When President Joe Biden took office in January 2021, one of his main goals had been to rein in carbon-dioxide (CO₂) emissions in order to curb climate change. A key action item to do so involved resurrecting the use of a decades-old metric known as the social cost of carbon (SCC).REF The SCC—also relied on heavily by the Obama Administration—is used by the Environmental Protection Agency (EPA) to try to quantify the economic consequences linked with carbon emissions.
The Biden Administration relied on three models—the Data-driven Spatial Climate Impact Model (DSCIM), the Greenhouse Gas Impact Value Estimator (GIVE), and the Howard and Sterner metanalysis models—to calculate the SCC.REF Policymakers frequently cite estimates of the SCC from these models to justify stringent regulations on a wide range of everyday items, from vehicles and household lamps to less obvious goods, such as pool pump motors.REF
Of course, given how the SCC underpins the cost-benefit analysis for many federal regulations that purport to curb climate change, it is crucial to assess the robustness of the associated models with respect to a variety of key assumptions. Heritage Foundation analysts conducted a similar analysis with models used during the Obama Administration, finding that the estimates produced were highly sensitive to key assumptions.REF This Special Report describes a similarly robust analysis of the GIVE model. Apart from more fundamental questions concerning the core of these integrated assessment models (IAMs), in general, the GIVE model’s estimates of the SCC also drop substantially with reasonable alternatives to just a few key assumptions. The analysis demonstrates that the Biden Administration cherry-picked assumptions to substantially increase the SCC, leveraging the model to justify more aggressive regulatory policies. As a result, we find that—as we demonstrated in prior research in terms of other IAMs—the GIVE model is also highly prone to user manipulation and thus not suitable for guiding regulatory policy.
The remainder of this Special Report is organized as follows. We begin with an introduction to IAMs and the GIVE model, in particular. We then discuss our robustness analysis of the GIVE model, testing sensitivity to a variety of key assumptions, namely, specification of discount rates, specification of a time horizon, and climate sensitivity. Subsequently, we assess a question that had largely been unexplored by the Biden Administration’s EPA—the probability of a negative value for the SCC. Lastly, we conclude with a series of policy recommendations for lawmakers. As a result of the model’s poor robustness, we urge both the second Trump Administration and the incoming 119th Congress not to use these models as a tool to guide regulatory policy.
Integrated Assessment Models (IAMs)
The SCC is estimated using a broader class of models called IAMs. IAMs are tools used to analyze and predict the interactions between human societies and the natural environment across various scales and timelines. Uniting knowledge across multiple disciplines, IAMs provide a quantitative framework for understanding the dynamics of the economy, society, and environment.REF We model each component mathematically by a series of equations and we enter each component into a damage function that estimates the SCC.
Overall damages of the SCC are estimated by a statistical method known as Monte Carlo simulation. Various components of these models are random. As a result, the models are repeatedly estimated to produce statistical distributions of the SCC. Standard point-and-interval estimators, such as means and percentiles, are reported to summarize the distributions of these damage estimates.
At their core, the damage functions that underpin the SCC are arbitrary and thus fundamentally flawed. Despite these flaws, IAMs have a long history of directly influencing policy, including in terms of playing a foundational role in establishing the framework of the Paris agreement.
A Brief History of the Social Cost of Carbon
The SCC was a key component of the Obama Administration’s climate agenda. The Obama Administration created the Interagency Working Group on Social Cost of Greenhouse Gases (IWG), consisting of various federal agencies, including the Department of Energy, the EPA, and the Council of Economic Advisers, to gather advice on providing estimates of the SCC for use in policy.REF Relying on three separate IAM models for its analysis, the Obama Administration’s IWG estimated the SCC to be between $26 and $95 per metric ton of CO₂ in 2050.REF With these estimates being the purported damages of CO₂ emissions, the estimates became an additional justification for regulating CO₂ emissions in the American economy.
Subsequently, the Trump Administration significantly rolled back the use of the SCC in policymaking, disbanding the IWG and ultimately focusing on the domestic damages within the United States.REF The Biden Administration, however, resurrected the use of the SCC in policy, employing three new models to estimate purported damages, the GIVE, the DSCIM, and the Howard and Sterner metanalysis models. Using these three models, the Biden Administration had estimated the SCC to be between $260 and $650 per metric ton of emissions in the year 2080.REF
The following section addresses the GIVE model and key parameters.
Overview of the GIVE model
Developed by Kevin Rennert and colleagues at Resources for the Future and other institutions, the GIVE model is another attempt at estimating the SCC.REF The GIVE model divides damages into four sub-components representing areas of climate damage: health, energy, agriculture, and coastal regions. Variables influencing these damage estimates include climate sensitivities, future emissions trajectories, assumptions about agricultural effects, and sea-level-rise related factors, among others.REF Mathematically, sub-damages are aggregated and used to compute marginal damages—the incremental economic damage of an extra 0.1 million tons pulse (or addition) of carbon emissions at a particular time under standard a priori assumed emissions trajectories. These marginal damages are weighted over time using discount factors (discussed in the following sections) and converted to damages per ton of CO₂ emissions.
SCC damages are simulated over the course of 10,000 Monte Carlo iterations. The associated probability distribution is summarized via the arithmetic average across these simulations. Of course, as with any model, the GIVE model is grounded in assumptions. The following section discusses a small subset of these assumptions to analyze the GIVE model’s sensitivity to slight alterations to these specifications.
A Robustness Analysis of Key Assumptions in the GIVE Model
The following are a few key assumptions in the GIVE model that can be altered.
Discount Rate. Following the logic of greenhouse gas policy, cutting CO₂ emissions is an investment in environmental capital. That is, cutting CO₂ emissions today supposedly improves the environment, and its flow of services, in the future. There are unlimited choices for investment—in environmental capital, human capital, or physical capital—that could provide improved flow of services in the future, but only limited resources for making those investments. Therefore, the limited resources should be allocated to those investments that provide the greatest improvement.
Investment in environmental capital (cutting CO₂ emissions) should only be made to the extent it provides a rate of return at least as large as the best likely return from alternative investment. The mechanism for making this comparison is discounting—calculating the discounted present value. The process is the inverse of compounding; it allows comparison of the future benefits of cutting CO₂ to the future benefits of alternative investment.
Choosing the most reasonable rate of return to use as the discount rate is critical for making efficient investment choices. Choosing too low a rate for discounting environmental benefits (reduced climate damage) of CO₂ emissions would harm those in the future by ignoring investments that would provide greater benefits than those from at least some of the CO₂ cuts.
Though it is impossible to know what would be the highest return that could be reasonably generated by alternative investment, the real rate of return on the New York Stock Exchange has been 7.0 percent over the past two centuries. That this is a very broad sampling across both investment areas and time spans argues strongly for its use.REF Some may lean toward a 3.0 percent discount rate, which is closer to the rate of return of the bond market.REF An unrealistic 2.0 percent or 3.0 percent discount rate makes costs look smaller and benefits, larger. Larger and more realistic discount rates render many environmental projects sought under the auspice of carbon neutrality financially worthless.
From 2003 through 2023, the White House Office of Management and Budget (OMB) required via Circular A-4 that government agencies use both 3.0 percent and 7.0 percent discount rates in their cost-benefit analyses, with flexibility to allow the use of additional rates.REF The Biden Administration, however, revised this policy, centering any cost-benefit analysis on a discount rate of 2.0 percent and recommending that long-term climate effects be handled via declining discount rates to account for long-term uncertainty.REF To do so, the OMB employed an approach known as Ramsey discounting to allow declining discount rates and model long-term uncertainty.
Of course, there is a vast degree of uncertainty associated with predictions of worldwide per capita consumption of the following several centuries, and, as a result, these changes alone induce significant uncertainty in the SCC as well. Regardless, the Biden Administration used discount rates in this manner alongside marginal damages to estimate the SCC. Table 1 depicts the SCC using 1.5 percent, 2.0 percent, and 2.5 percent Ramsey discount rates also computed by the Biden Administration’s IWG.
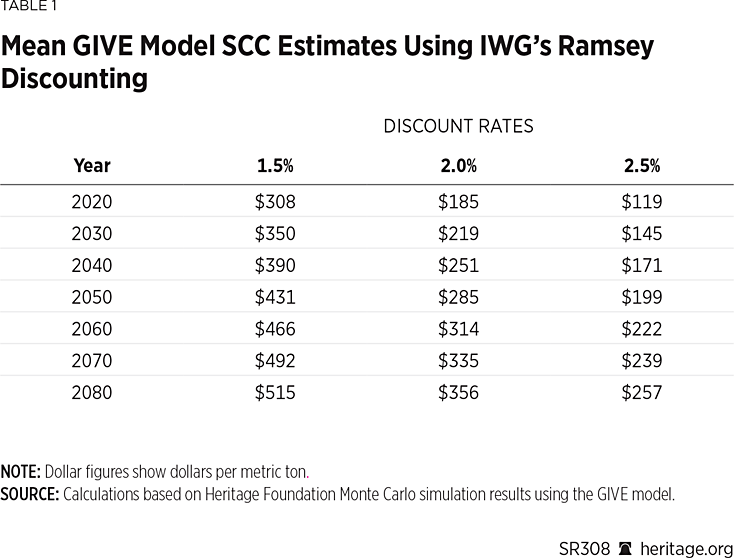
As made clear in Table 1, the GIVE model’s estimates increase markedly over time. The estimated damages rises to $515 per metric ton of emissions in 2080 at a 1.5 percent discount rate and $257 per metric ton at a 2.5 percent discount rate. These results coincide with the values reported in the EPA’s report.REF
Although an often-reported summary statistic, the arithmetic mean of a dataset only conveys so much information about the distribution of data from which it represents.REF It is therefore useful to understand the overall distribution of the SCC. Chart 1 depicts the probability distribution of the GIVE model estimates for 2030.
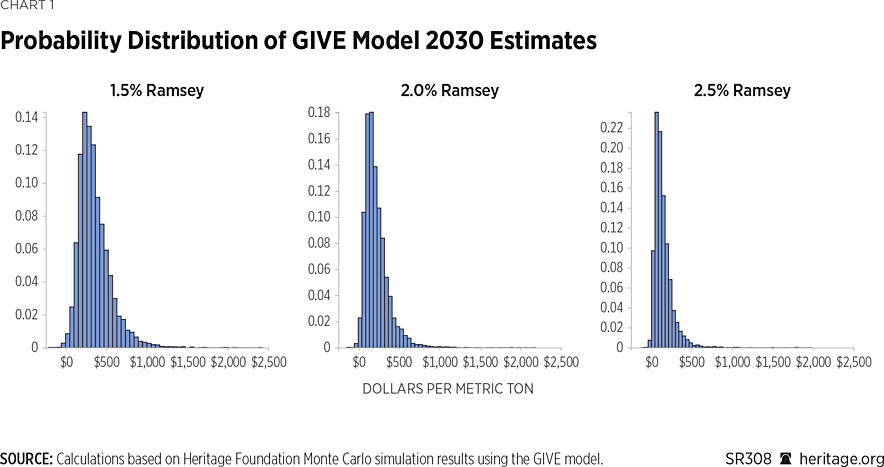
As Chart 1 illustrates, the EPA’s estimates of the SCC via the GIVE model are highly skewed in nature. For example, under a 1.5 percent Ramsey rate, the EPA’s estimate of the SCC in 2030 has a mean of $350 (standard deviation $199) and the 95th percentile of the SCC is $717 per metric ton. Under a 2.0 percent Ramsey rate, the EPA’s estimate of the SCC has a mean of $219 (standard deviation $155) with a 95th percentile of the SCC of $502 per metric ton. Under a 2.5 percent Ramsey rate the estimated mean is $145 (standard deviation $120) with a 95th percentile of $352 per metric ton. The upper tails of the distribution (manifested in the 95th percentiles) contribute to increasing the EPA’s reported mean value of the SCC.
On the other hand, the SCC’s median estimates, the 50th percentile, are significantly lower than the reported means. For example, for the distributions presented in Chart 1 for 2030, the median estimates are $312, $184, and $116 per metric ton, significantly lower than their corresponding means. Table 2 depicts the median estimates of the SCC for 2020 to 2080 under all assumptions of discount rates made by the EPA.
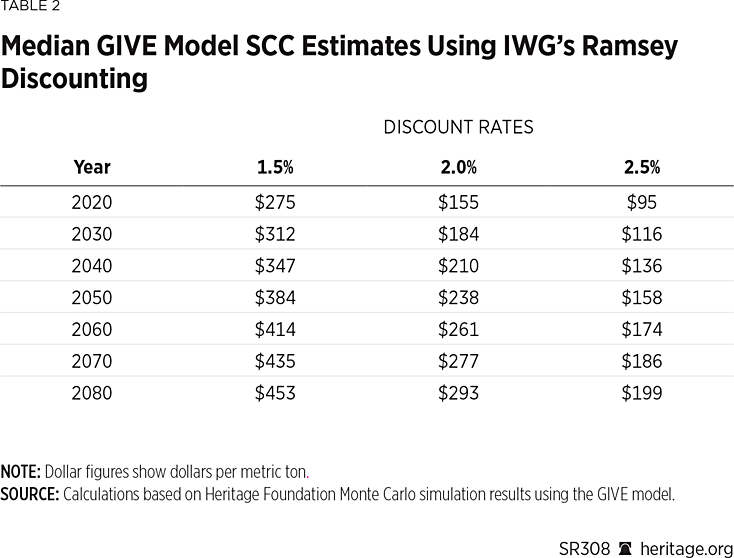
As Table 2 illustrates, as is the case for 2030, the median estimates of the SCC still decline as the discount rate increases but are substantially lower than their corresponding means. This property—unreported by the EPA—reveals the effect of the skewed nature of the SCC’s distributions on its summary statistics: A few low-probability, albeit large, SCC values inflate the distribution’s mean estimates that the EPA uses to summarize the SCC.REF As discussed under “Equilibrium Climate Sensitivity” below, subsequently, these large estimates are largely due to a few low-probability high-end global warming scenarios being simulated across the Monte Carlo analysis.
We also re-ran the GIVE model using the deterministic discount rate methodology that had previously been used by the Obama Administration using 2.0 percent, 3.0 percent, and 5.0 percent deterministic discount rates. These results are presented in Table 3.
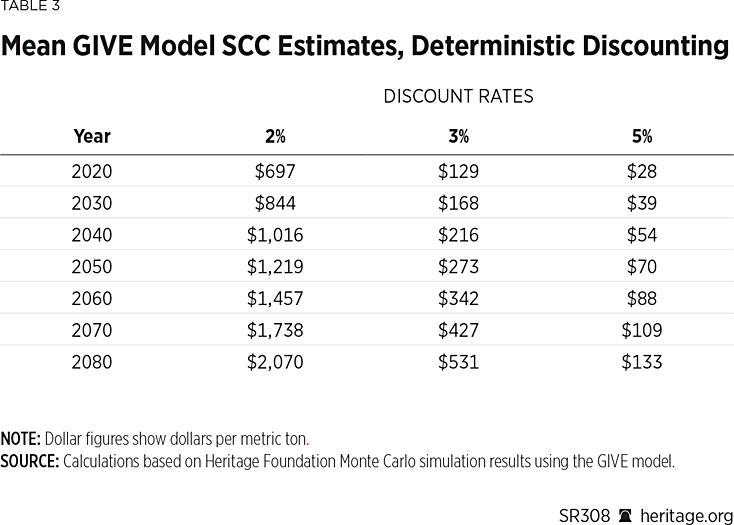
As Table 3 shows, the mean SCC estimates under the Obama Administration’s approach also decline as the discount rate increases, ranging from $697 in 2020 to $2070 (per metric ton) in 2080 under a 2.0 percent discount rate, from $129 in 2020 to $531 (per metric ton) in 2080 under a 3.0 percent discount rate, and from $28 in 2020 to $133 (per metric ton) in 2080 under a 3.0 percent discount rate.
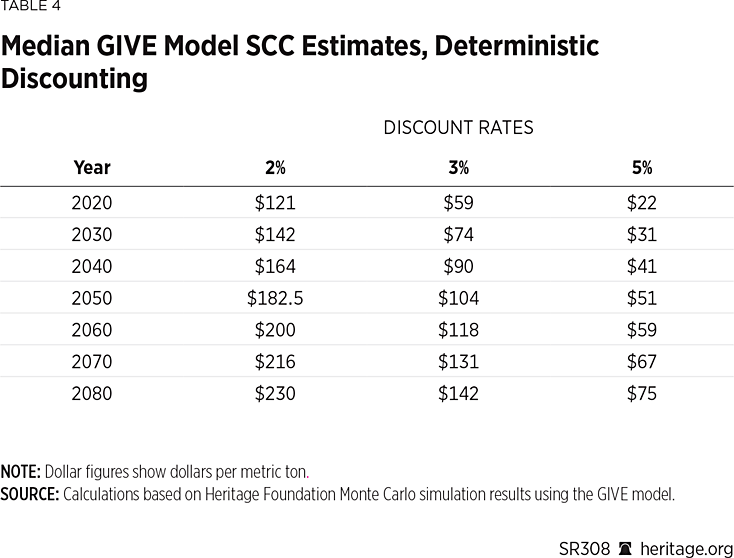
To compare the effect of changes in discount rate methodology between the Obama and Biden Administrations, we computed percentage changes between the low, medium, and high discount rates that the two Administrations used. In particular, we compared the SCC under the Biden Administration’s choice of a 1.5 percent Ramsey discount rate to the Obama Administration’s choice of a 2.0 percent deterministic discount rate; the Biden Administration’s choice of a 2.0 percent Ramsey discount rate to the Obama Administration’s choice of a 3.0 percent deterministic rate; and, lastly, the Biden Administration’s choice of a 2.5 percent Ramsey discount rate to the Obama Administration’s choice of a 5.0 percent discount rate. These choices of discount rates are hereafter referred to as low, mid-level, and high discount rate specifications. Our results—computed as percentage changes—are presented in Tables 5 and 6.
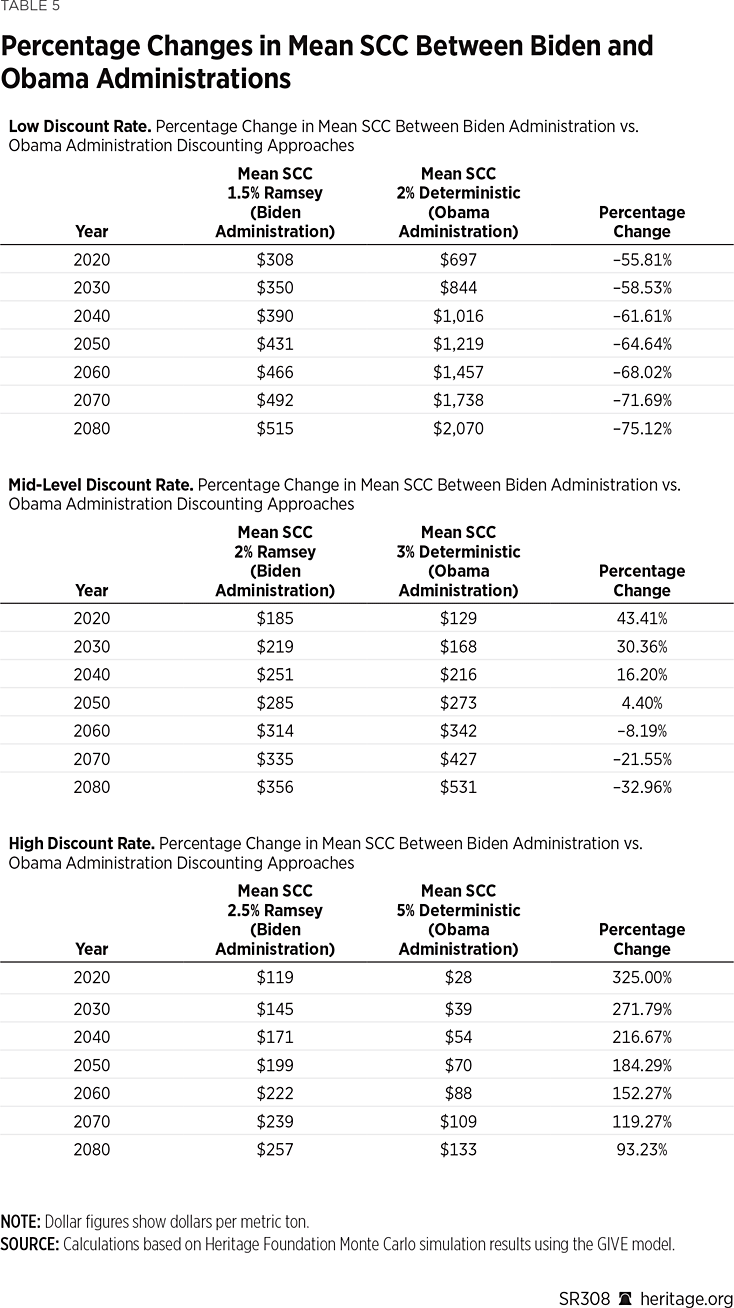
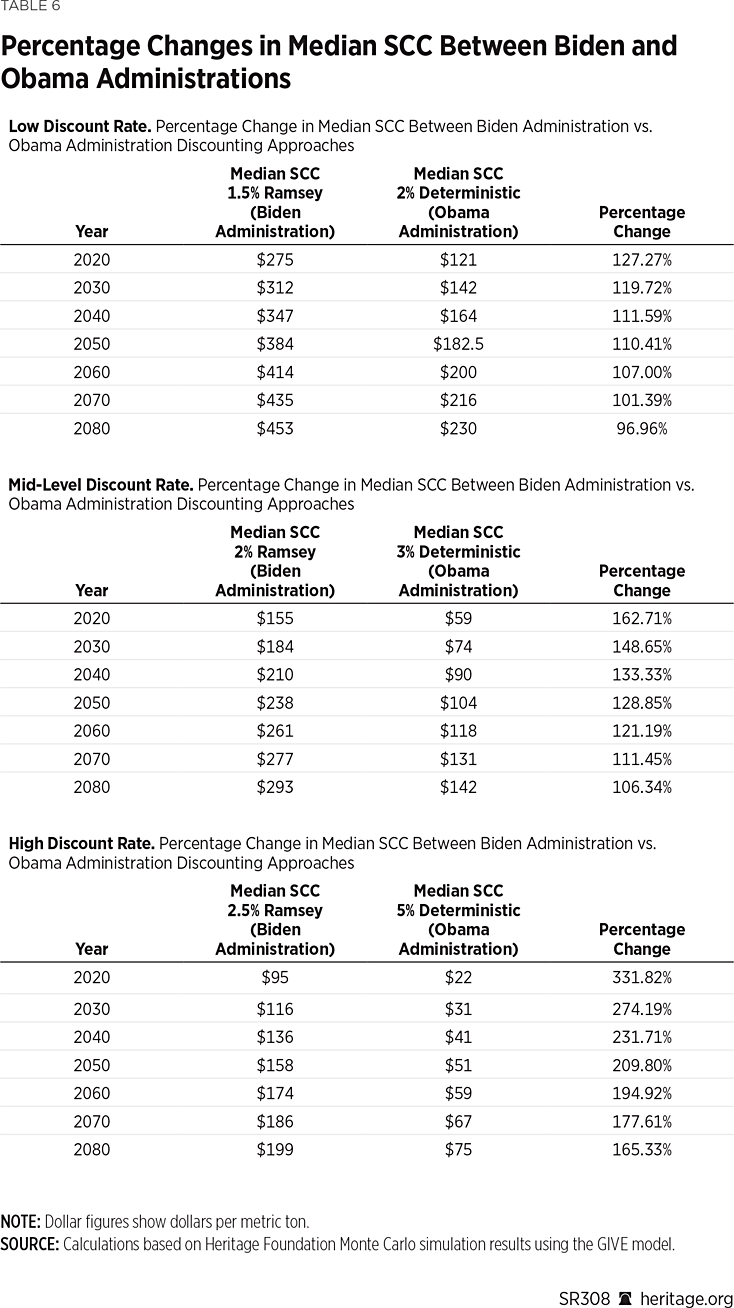
As Table 5 illustrates, for the lowest discount rates (1.5 precent Ramsey and 2.0 percent deterministic), mean SCC estimates generally appear to be higher under the deterministic discounting scenarios used during the Obama Administration. For the mid-level discount rate (2.0 percent Ramsey and 3.0 percent deterministic), the mean SCC estimates are higher under the Biden Administration’s approach through 2050 and the Obama Administration’s are higher from 2060 to 2080. Lastly, for the highest discount rates (2.5 percent Ramsey and 5.0 percent deterministic), the Biden Administration’s estimates are highest for all years. However, examination of the median estimates of the SCC (see Table 6) shows a markedly different story, with the Biden Administration’s statistics being significantly higher than the Obama Administration’s.
Altogether, under both approaches, large but low probability SCC estimates in the tails of the distributions ratchet up the mean estimate of the SCC. Additionally, we also estimated the SCC under a 7.0 percent deterministic discount rate, which had previously been mandated by the OMB to be included in cost-benefit analyses.REF Summary statistics—mean and median estimates of the SCC—are contained in Table 7.
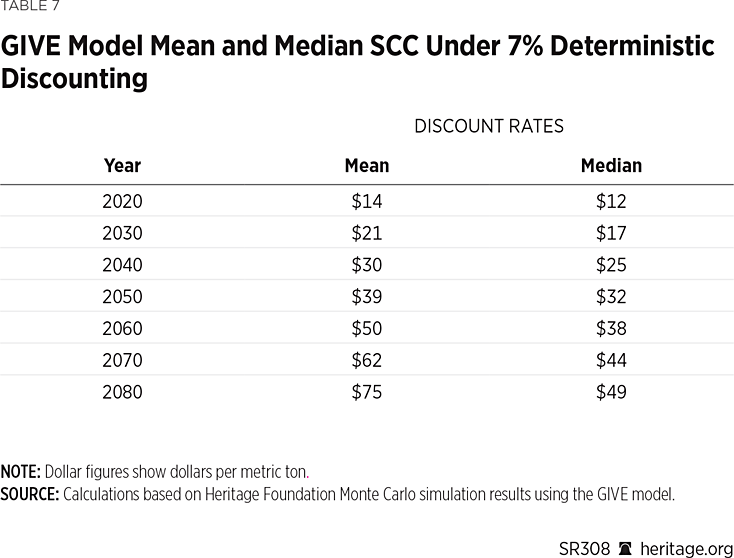
As Table 7 illustrates, these estimates of the SCC are substantially lower than any estimates presented by the Biden Administration. The most comparable estimates would be the Biden Administration’s estimates under a 2.5 percent Ramsey discount rate. For example, in 2080, the mean estimate of the SCC is 70 percent lower ($257 per metric ton versus $75 per metric ton) and the median estimate is 75 percent lower ($199 per metric ton versus $49 per metric ton). Chart 2 provides a visual representation of the distribution of the SCC under 2.0 percent, 3.0 percent, 5.0 percent, and 7.0 percent deterministic discount rates.
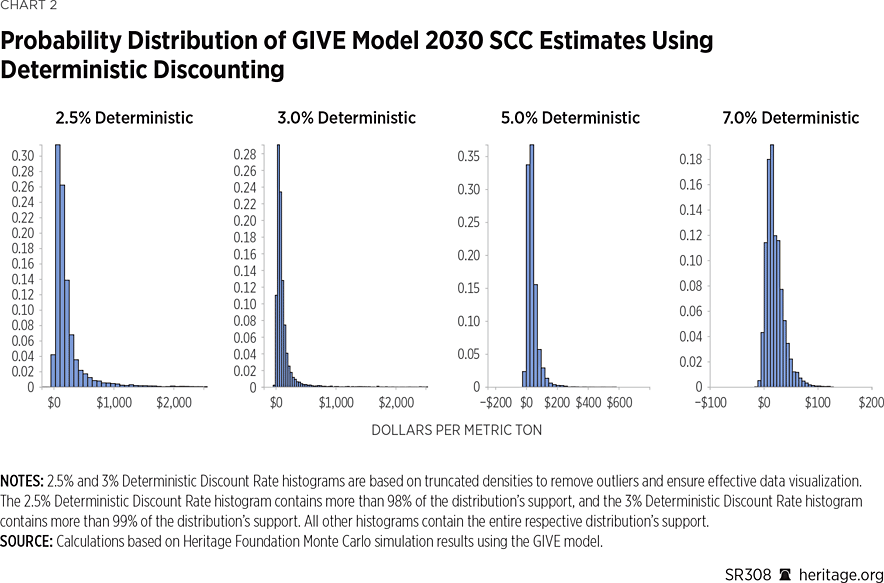
Chart 2 again demonstrates the highly skewed nature of the SCC. For example, at a 2.0 percent discount rate, the distribution has a standard deviation of $7,818 with a 95th percentile of $1,199. At 3.0 percent and 5.0 percent discount rates, the standard deviations drop to $783 and $35, with 95th percentiles of $380 and $102, respectively. At a 7.0 percent discount rate, these values drop even further—to just $16 and $52, respectively.
Time Horizon. As discussed, SCC estimates are based on aggregate damages nearly 300 years into the future. Given the immense difficulty that economists face in making accurate forecasts several decades in advance, such long-term predictions are inherently uncertain and unreliable. Variables, such as technological progress, GDP growth, and greenhouse gas emissions centuries ahead, add layers of complexity and unpredictability to these projections.
To assess the effect of this multi-century time horizon on SCC estimates, we re-estimated the model over a less (albeit also) unrealistic time horizon of 150 years. Our results are presented in Tables 8 to 11, using the same Ramsey discount rates that the Biden Administration used, as well as the respective percentage changes.
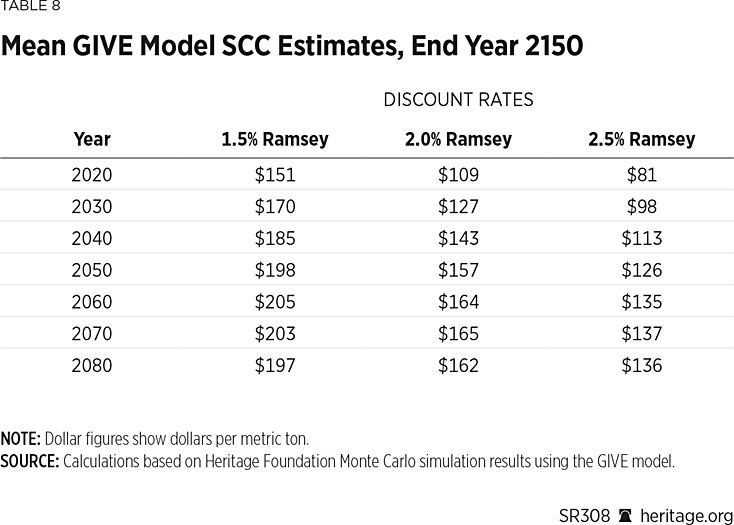
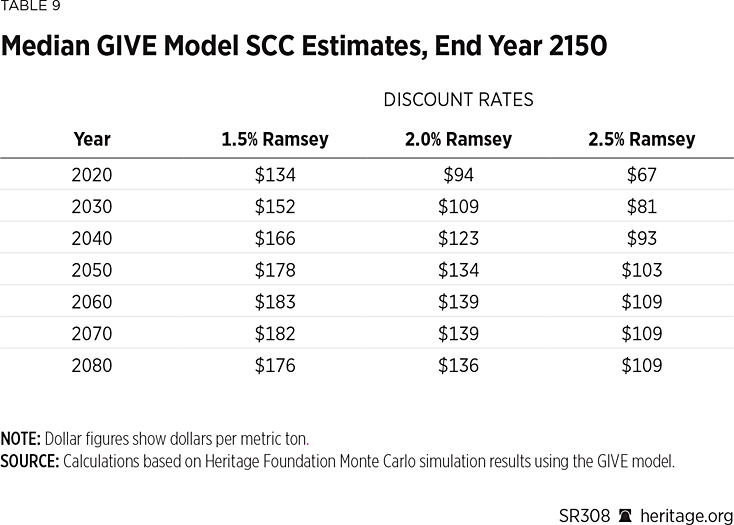
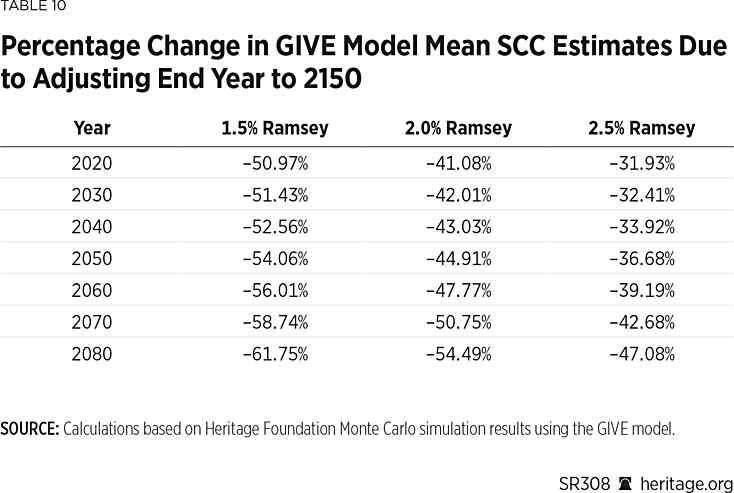
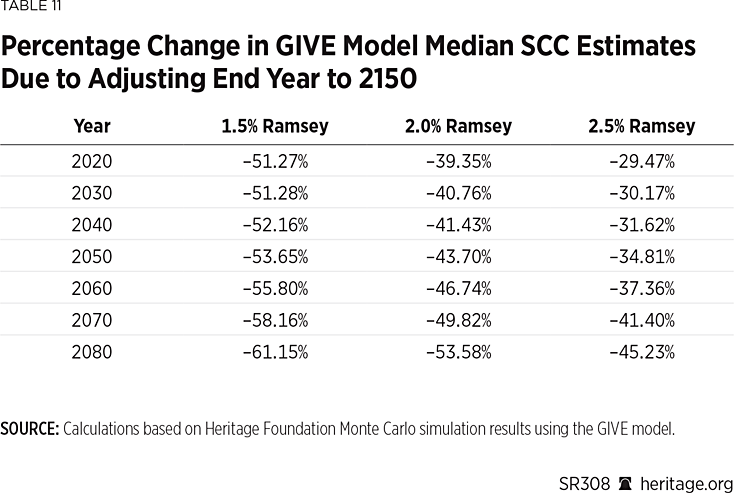
As Tables 10 and 11 illustrate, regardless of whether the mean or median is used to summarize the SCC, the summary statistic drops dramatically—on average by more than 40 percent—as a result of truncating the model’s time horizon by 150 years. By 2080—when damages are reported to be the highest—these reductions are largest. Most notably, at a 1.5 percent discount rate, the mean SCC drops by over 60 percent from $515 to $197 per metric ton. At a 2.5 percent discount rate, steep reductions persist where damages drop from $257 to $136 per metric ton, a decrease of more than 47 percent. As shown in Table 11, the median also incurs similar reductions.
Chart 3 depicts the distribution of the SCC for the year 2030 under this altered time horizon.
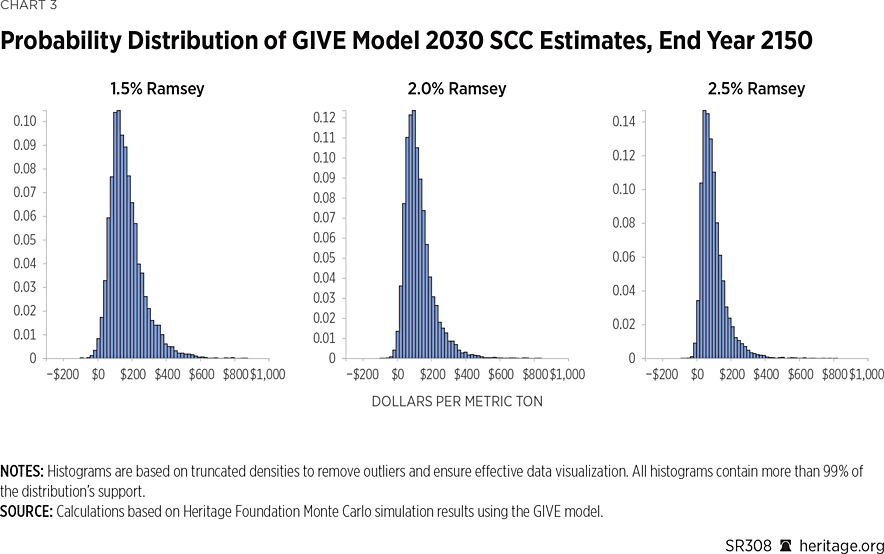
Once again, the skewed nature of the SCC remains intact; however, the distribution is considerably less skewed than the EPA’s original estimates. In particular, under 1.5 percent, 2.0 percent, and 2.5 percent Ramsey discount rates, the mean SCC estimates are $170, $127, and $98 (standard deviations $98, $84, and $72), with 95th percentiles of $357, $288, and $234 per metric ton, respectively. When compared to the EPA’s analysis using a time horizon of 300 years, these reductions are as high as 50 percent. These reductions clearly indicate that the EPA’s estimates are amplified by the deliberate inclusion of projected and highly uncertain damages from between 150 and 300 years into the future.
Equilibrium Climate Sensitivity
Yet another important assumption behind the SCC is the specification of the Earth’s sensitivity to CO₂ emissions. Scientists agree that the Earth’s temperature warms in response to CO₂ emissions; an open question is to the extent to which this warming occurs. The concept of equilibrium climate sensitivity (ECS) enables the quantification of the Earth’s temperature response due to a doubling of atmospheric carbon-dioxide emissions.
Although the true value of ECS is up for debate, the Intergovernmental Panel on Climate Change’s (IPCC’s) Sixth Assessment Report indicates that it most likely falls between 2.0°C and 5.0°C.REF Instead of using a single number, or point estimate, for the ECS, the IAMs draw on a distribution of possible values for the ECS. These distributions constitute a spectrum of values in which potential temperatures are weighted by their probability of occurrence. As a result, Monte Carlo methods are employed to sample from the distribution. This pivotal variable heavily influences the projections of future global temperature, which affects the social cost of carbon.
The EPA assumes a median value of 2.95°C as its ECS in its modeling of the SCC. Empirical observation, however, suggests that IPCC climate models overpredict warming and deviate significantly from observed data.REF Tables 12 to 19 depict the GIVE model’s estimates for the SCC under two alternative ECS distributions that reflect these differences. One distribution was published by John Christy and Richard McNider in 2017, and the other was published by Nic Lewis in 2022 in separate peer-reviewed journals.REF
Tables 12 to 15 provide SCC estimates and associated percentage changes in with respect to EPA SCC estimates using alternative ECS assumptions suggested by Christy and McNider in 2017 (assuming an end year of 2300).
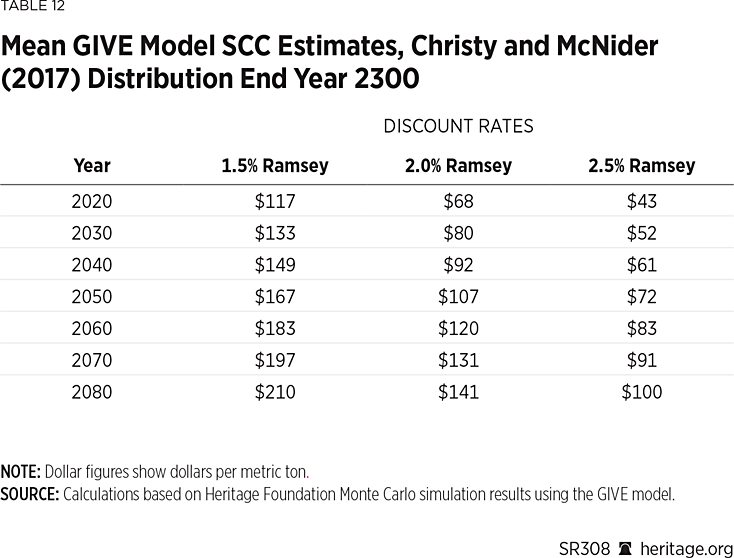
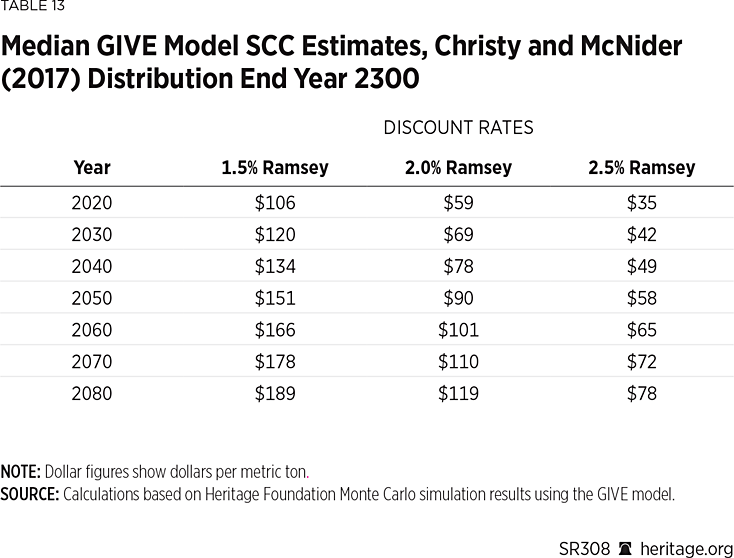
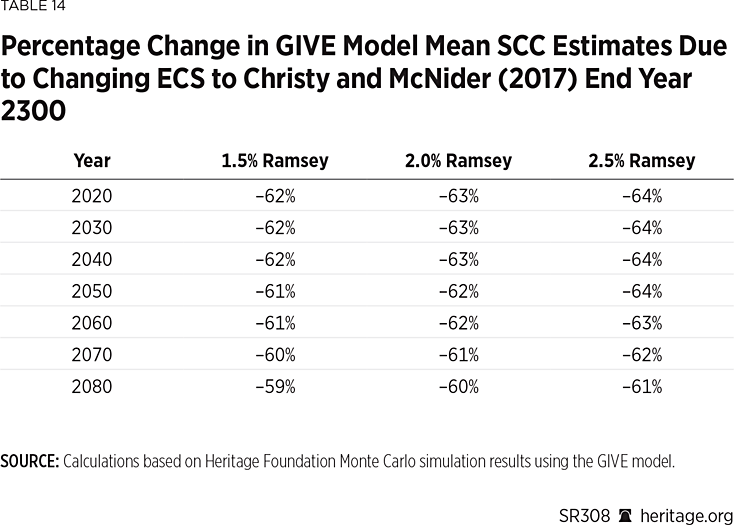
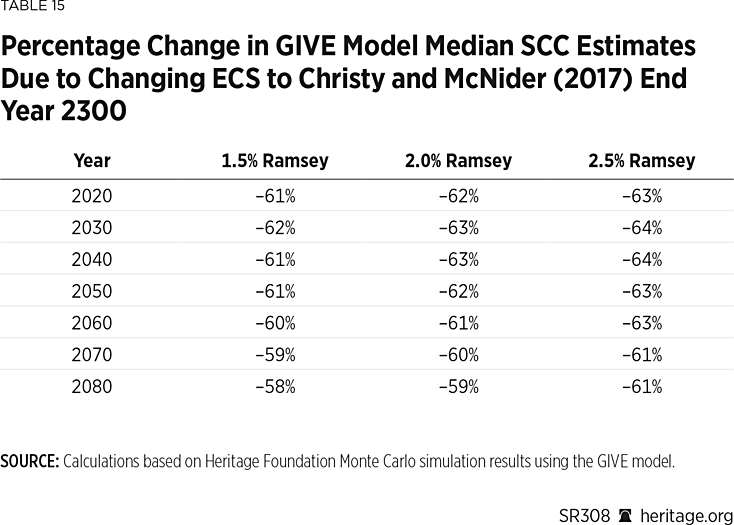
As Tables 12 to 15 also illustrate, significant reductions are observed in both the mean and median estimates of the SCC as a result of changing the assumptions about climate sensitivity, again assuming an end year of 2300. These results underscore the SCC’s sensitivity to this key assumption as well. Distributions of the SCC for 2030 are presented in Chart 4.
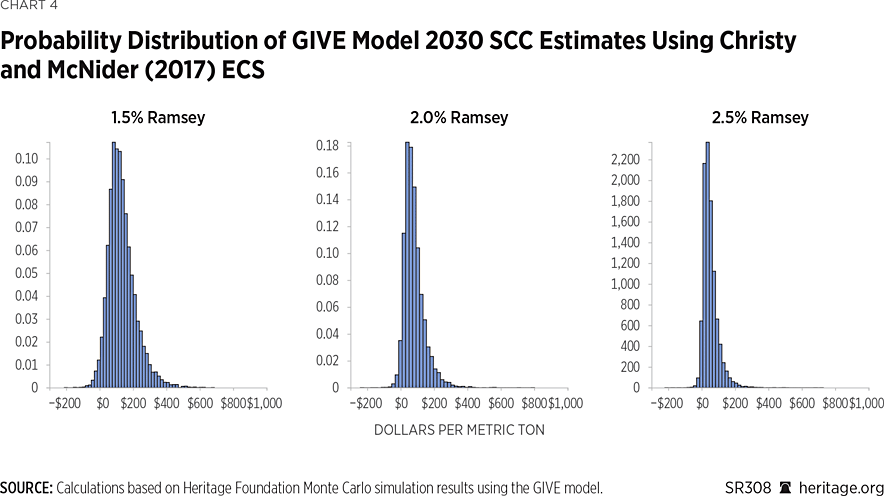
As is shown in Chart 4, the SCC is markedly lower under the Christy–McNider (2017) distribution than under assumptions made by the EPA. The mean estimate of the SCC is $133, $80, and $52 per metric ton (with 95th percentiles of $284, $193, and $135 under 1.5 percent, 2.0 percent, and 2.5 percent Ramsey discount rates, respectively, thus reducing the SCC by more than 60 percent compared to the EPA’s reported estimates. As Tables 14 and 15 show, these reductions hold for other years as well both with respect to mean and median estimates of the SCC.
Tables 16 and 17 contain the SCC estimates upon changing the ECS specification to that of Lewis (2022).
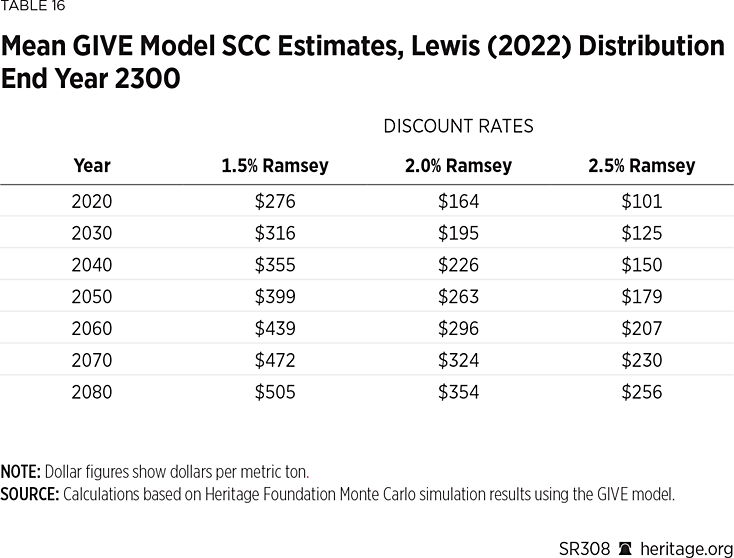
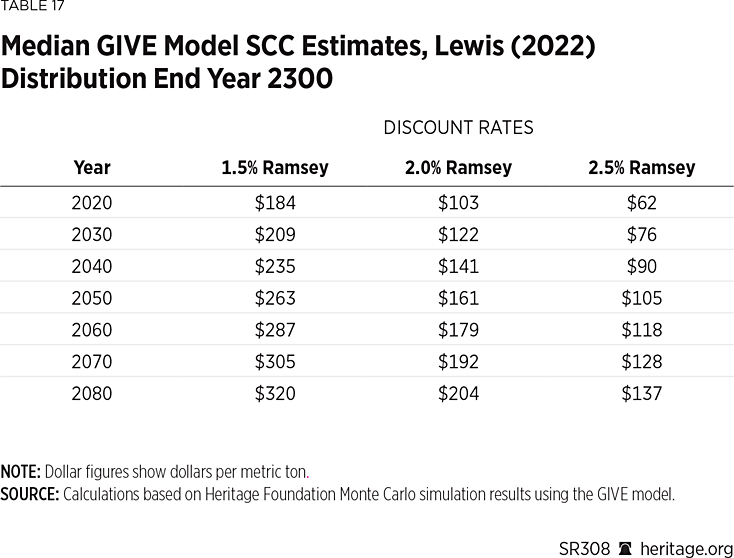
As Tables 16 and 17 reveal, the GIVE model’s mean and median drop substantially upon changing the ECS to Lewis’s assumptions (2022). Tables 18 and 19 contain percentage changes for these two statistics.
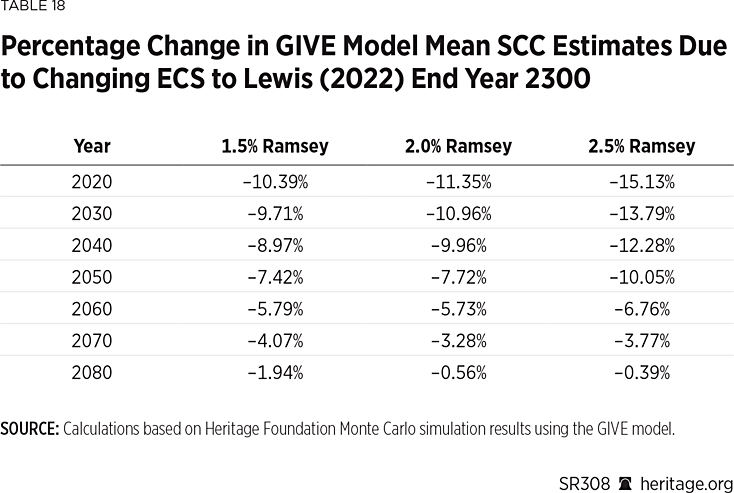
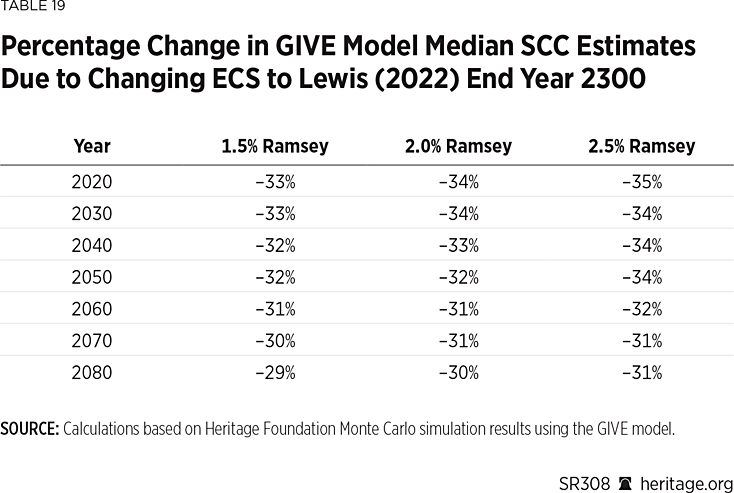
As Tables 18 and 19 show, there are significant reductions in the SCC as a result of altering the EPA’s ECS assumptions to those of Lewis (2022). In particular, the mean estimate of the SCC drops by as much as 10 percent or more, while the median drops by more than 29 percent. These modest reductions in the mean SCC and more pronounced changes in the median are once again manifestations of the skewed nature of the SCC. The SCC’s distribution for the year 2030 is depicted in Chart 4.
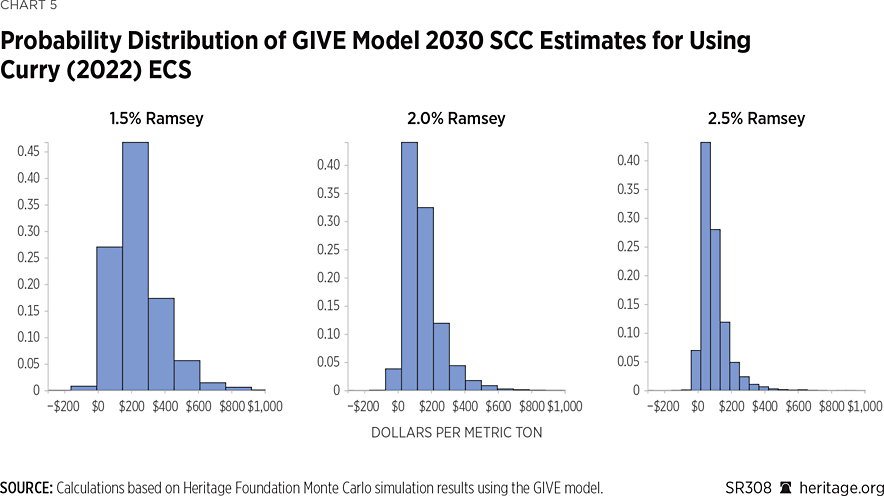
As Chart 5 indicates, under 1.5 percent, 2.0 percent, and 2.5 percent Ramsey discount rates, the mean SCC estimates are $316, $195, and $125 (standard deviations $7,721, $4782, and $2,898) with 95th percentiles of $517, $353, and $249 per metric ton, respectively.
Our analysis using alternative choices of ECS distributions significantly reduces the EPA’s estimate of the SCC, thereby illustrating that the GIVE model is highly sensitive to this assumption as well. As a result, it's easy for lawmakers to ratchet up the SCC by choosing unnecessarily high assumptions about climate sensitivity.
Probability of a Negative Social Cost of Carbon
Carbon dioxide—a necessary component of photosynthesis—has the capacity to confer many environmental benefits, including increased agricultural yields and longer growing seasons, especially under moderate warming.REF In fact, unlike some IAMs, the GIVE model allows the SCC to be negative to manifest situations where any such benefits may outweigh purported damages.REF A negative SCC translates into benefits for additional CO₂ emissions. A comprehensive cost-benefit analysis of this nature is largely unexplored by the EPA.
Tables 20–24 provide estimates of the probability of a negative SCC under the Biden Administration’s assumptions as well as the assumptions made in this Special Report.
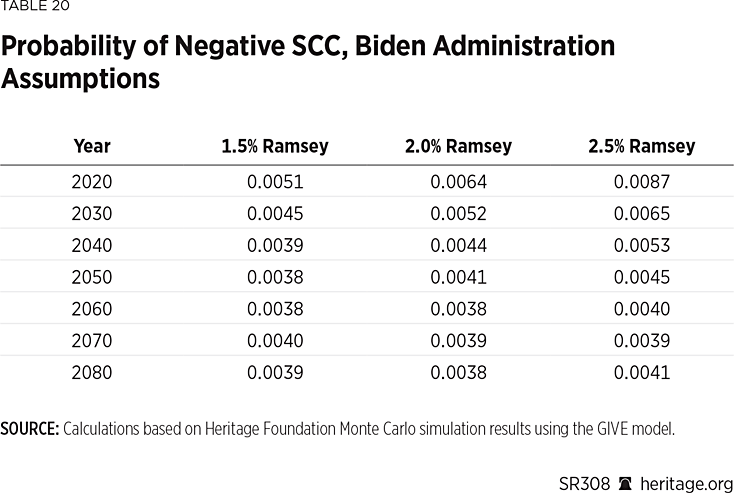
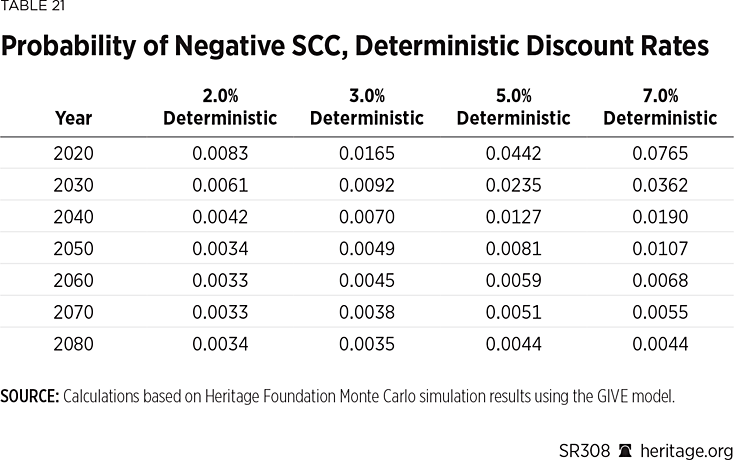
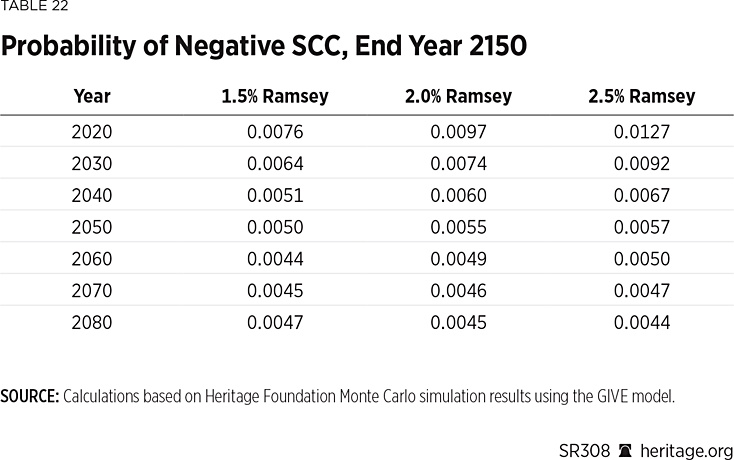
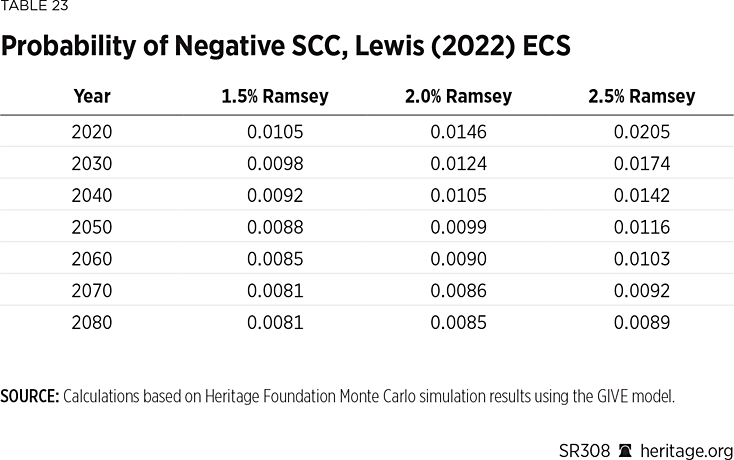
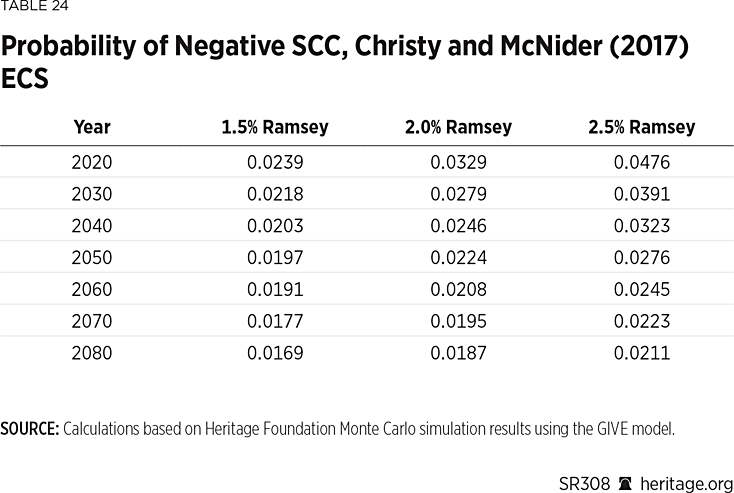
As Tables 20 to 24 show, probabilities of negative SCC are small under assumptions made by the EPA but increase substantially under alternative assumptions. For example, under the Christy and McNider (2017) ECS, probabilities range from 0.02 to 0.04, increases of more than 200 percent with respect to probabilities based on the EPA’s specifications.
A negative SCC (positive CO₂ benefits) signifies that CO₂ emissions should not be taxed but subsidized. We do not take the position that CO₂ emissions should be either taxed or subsidized, but the model’s negative estimates under reasonable assumptions clearly demonstrate how susceptible these models are to user manipulation.
More fundamentally, however, all probabilities presented in Tables 20 to 24 are based on the same assumptions about agricultural productivity in the GIVE model made by the EPA. In a 2019 study, co-author of this Special Report Kevin Dayaratna, Ross McKitrick, and Pat Michaels conducted a similar analysis altering assumptions of agricultural productivity in another IAM—the Climate Framework for Uncertainty, Negotiation and Distribution (FUND) model.REF The study finds that increasing agricultural productivity in reasonable ways significantly reduces the model’s estimates of the SCC to essentially zero, with substantial probabilities of negative SCC. A similar analysis of altering agricultural productivity assumptions in the GIVE model used by the Biden Administration is a worthy avenue of future research.
Policy Implications and Conclusions
From a policy perspective, the SCC is intended to quantify the economic effect of climate change and thus provide a basis of regulating CO₂ emissions, purportedly to curb climate change.REF Clearly, however, the SCC is devoid of the robustness necessary to offer meaningful advice in regulatory policy. As a result, we offer the following policy recommendations:
- As part of his “Unleashing American Energy” Executive Order on January 20, 2025, President Donald Trump disbanded the Biden administration’s Interagency Working Group’s input and use of the SCC in rulemaking.REF The act also notes that:
“The calculation of the “social cost of carbon” is marked by logical deficiencies, a poor basis in empirical science, politicization, and the absence of a foundation in legislation. Its abuse arbitrarily slows regulatory decisions and, by rendering the United States economy internationally uncompetitive, encourages a greater human impact on the environment by affording less efficient foreign energy producers a greater share of the global energy and natural resource market. Consequently, within 60 days of the date of this order, the Administrator of the EPA shall issue guidance to address these harmful and detrimental inadequacies, including consideration of eliminating the “social cost of carbon” calculation from any federal permitting or regulatory decision.”
- As this as well as prior Heritage Foundation research has shown,REF the SCC is extremely sensitive to very reasonable changes to assumptions and thus highly susceptible to user manipulation. As this Special Report shows, during the prior four years, the Biden administration leveraged this fact to tailor its own inputs to the SCC to justify predetermined regulatory policies. Therefore, the EPA should eliminate the use of SCC in any and all federal permitting and regulatory rule-making.
- Even if the EPA acts on the above recommendation, a future administration could always bring back the SCC as the Biden Administration had done four years ago. As a result, Congress should prohibit—by statute—the use of the SCC in policymaking. Such a bill was proposed by Representatives Richard Hudson (R–NC) and Kevin Hern (R–OK) and several other lawmakers during the 118th Congress but did not become law.REF Lawmakers should pursue legislation to prohibit use of the SCC in policymaking in order to prevent future Administrations, of either party, from using the SCC.
Statistical modeling can be valuable for understanding real-world phenomena. However, a critical analysis of robustness to key assumptions is paramount for understanding whether any such model can be remotely useful for guiding public policy. As this Special Report shows, however, the GIVE model fails, without doubt, the test of any such sensitivity analysis.
Alexander Frei is Senior Research Associate in the Center for Data Analysis at The Heritage Foundation. Kevin D. Dayaratna, PhD, is Acting Director, Chief Statistician, and Senior Research Fellow in the Center for Data Analysis. Austin Gae is Research Associate in the Center for Energy, Climate, and Environment at The Heritage Foundation.


