Many politicians and pundits have suggested that the frequency and severity of hurricanes has been increasing due to greenhouse gas emissions and climate change. President Joe Biden, for example, has claimed over the course of his presidency that the effects of extreme weather—including Hurricane Ian in 2021—have been exacerbated by climate change.REF Others have echoed these concerns, including most recently Hurricanes Helene and Milton.REF This Special Report examines whether claims that hurricanes have increased in frequency and severity over time have any merit.
This report starts with a brief history of hurricanes, discussing the devastation they have caused for generations, well before climate change was ever a concern. It continues with a discussion of long-term trends in the frequency and intensity of hurricanes—the authors find no meaningful relationship to carbon-dioxide (CO2) emissions.
This report also presents quantitative analysis of the severity of the economic damages caused by hurricanes. The analysis finds that although damages have indeed increased over the past century in conjunction with changes in CO2 emissions and global temperatures, these changes are a result of growth in societal wealth. In the broader context of economic growth, these results merely show that this income growth has enabled society to handle these adverse events more effectively.
Though there has been no long-term trend in hurricane activity, such activity does fluctuate over long cycles. The final section addresses natural factors that are associated with this cyclical incidence and severity of hurricanes. These factors have a much clearer and more compelling link to hurricanes than increases in global temperatures do. Taken together, the evidence is clear. Although there are factors that influence the incidence and severity of hurricanes, there has been no meaningful increase in these storms in modern times, and greenhouse gases are not responsible for their variation.
A Brief History of Hurricanes in America
Understanding the full extent of the history of hurricanes has proven difficult given that satellite monitoring of remote areas has only been possible since the 1970s. But for coastal residents, a number of major hurricanes have indeed made their mark in history for the extensive damage they caused. For example, the Great Colonial Hurricane of 1635 hit the Jamestown Settlement and the Massachusetts Bay Colony a mere 15 years after the founding of Plymouth Plantation. The storm made landfall that summer, striking Narragansett, Rhode Island, in the morning and then tracking somewhere between Boston and Plymouth, Massachusetts. The hurricane produced a storm surge of between 14 feet and 20 feet in Rhode Island, toppling trees, destroying homes, and ripping ships from their anchors.REF More than 100 years later, the Great Hurricane of 1780 ravaged the eastern Caribbean islands with winds estimated to top 200 miles per hour (mph), killing an estimated 27,500 people.REF
Over the following century, at least 95 hurricanes hit the continental United States with varying intensity.REF In 1900, the Galveston Hurricane that struck Texas killed between 8,000 and 12,000 people, making it the deadliest natural disaster in U.S. history. Subsequently, the Great New England Hurricane of 1938 was one of the most destructive and powerful storms ever to strike southern New England. The center made landfall at the time of astronomical high tide, moving rapidly northward.REF Unlike most storms, this hurricane did not weaken on its way toward southern New England, due to its rapid forward speed.
The strongest winds ever recorded in the region occurred at the Blue Hill Observatory with sustained winds of 121 mph and a peak gust of 186 mph. The hurricane produced storm tides of 14 feet to 18 feet across most of the Connecticut coast, with 18-foot to 25-foot tides from New London east to Cape Cod. The destructive power of the storm surge was felt throughout the coastal community. Narragansett Bay took the worst hit, where a storm surge of 12 feet to 15 feet destroyed most coastal homes, marinas, and yacht clubs. Downtown Providence, Rhode Island, was submerged under a storm tide of nearly 20 feet. These epic storms have not been equaled in New England since.
From 1900 to 1960, 112 hurricanes hit the continental United States, including the Florida Keys Hurricane of 1919, the Great Atlantic Hurricane of 1944, Hurricane Carol in 1954, Hurricane Diane in 1955, and Hurricane Donna in 1960, among others. Each of these storms occurred before substantial carbon-dioxide emissions were produced by humanity and global temperatures were noted to increase.
What Do the Data Show About the Frequency of Hurricanes in the United States?
Although hurricanes have been an ongoing concern for centuries upon centuries, it is worthwhile to examine trends in the frequency and intensity of hurricanes over time, particularly with respect to carbon-dioxide emissions.
An Analysis of Frequency and Intensity with Respect to Global Temperatures. Hurricanes are quantitatively categorized using the Saffir–Simpson Hurricane Wind Scale at levels ranging from 1 (least severe, exceeding 74 mph winds) to 5 (most severe, exceeding 157 mph winds). The National Oceanic and Atmospheric Administration (NOAA) deems Category 3 hurricanes (111 mph to 129 mph) or higher to be “major hurricanes because of their potential for significant loss of life or damage.”REF
Chart 1 depicts U.S. average maximum air temperatures from 1950 to 2024 based on data provided by the NOAA and chart 2 presents changes in CO2 emissions in fossil fuels both in the United States and globally, which some have argued have been a driver of changes in trends in hurricanes over the past two centuries.REF
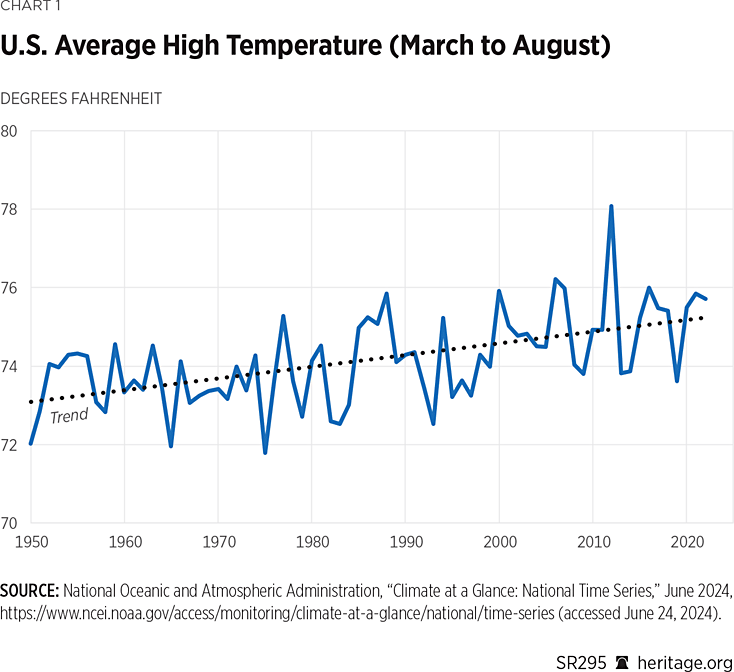
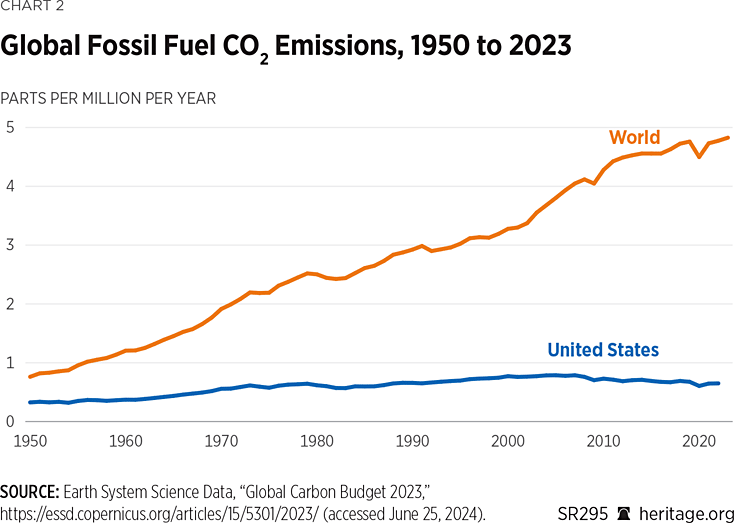
Chart 3, on the other hand, depicts trends in the frequency (raw number of aggregate and major hurricanes) and intensity (presented in terms of central pressure and maximum wind speed) of landfalling hurricanes in the continental United States since 1850.
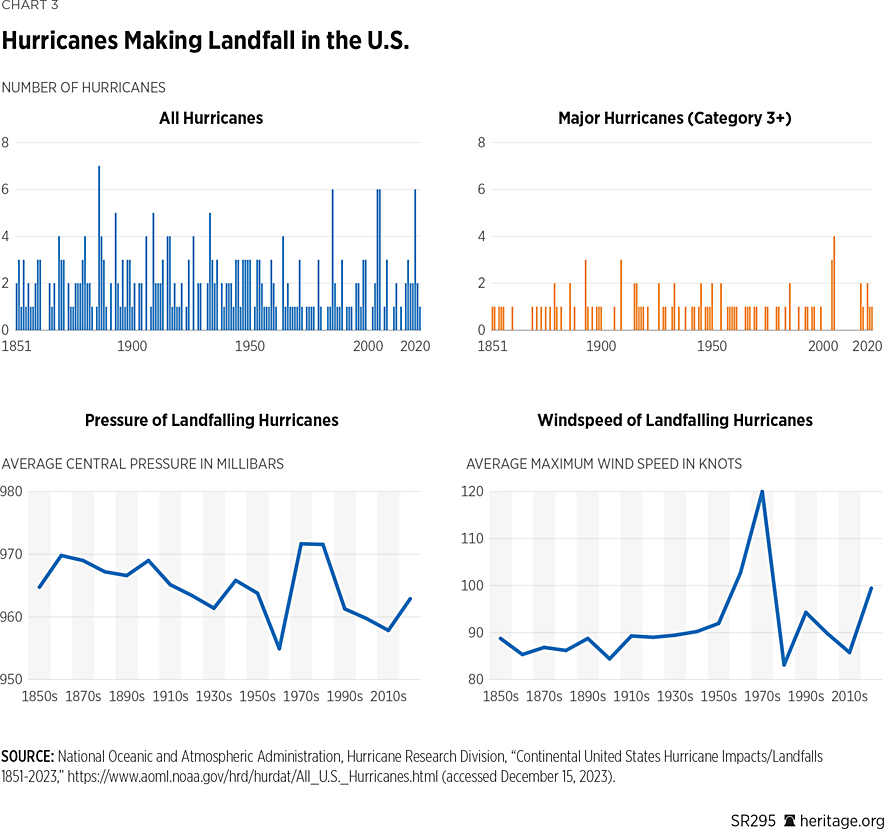
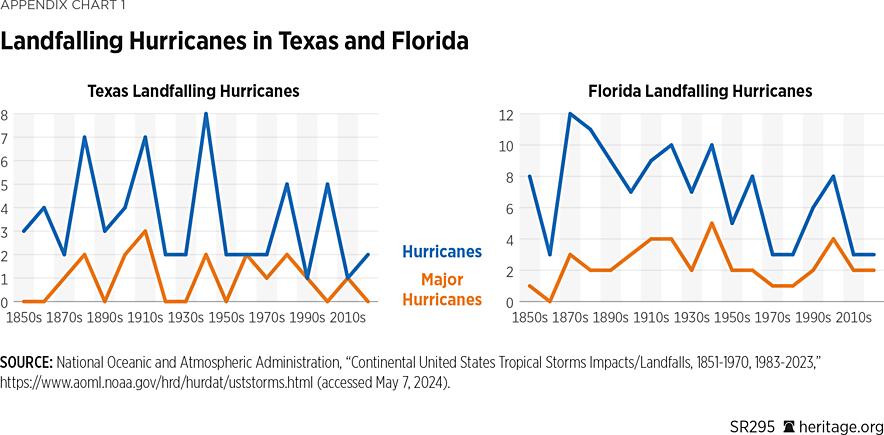
As Charts 1 and 2 illustrate, there have indeed been increases in global temperatures and carbon-dioxide emissions since the early 1900s. However, as the first row of Chart 3 illustrates, since the start of the 20th century, America has seen an average of 17 hurricanes per decade, with slightly more than five hurricanes per decade exceeding Category 3 levels. This data also indicates slightly more than two hurricanes at or exceeding Category 4 (exceeding 130 mph winds) per decade, meaning they are relatively rare. As Chart 3 shows, there is no clear overall trend for the frequency of landfalling hurricanes in the United States regardless of changes in temperatures, both domestically and globally. Appendix Chart 1 depicts similar data specifically for Texas and Florida. As they illustrate, these states also do not have any discernable trends in hurricanes over time.
Another question is whether landfalling hurricanes have increased in intensity over time, particularly with respect to increases in global temperatures. The second row in Chart 3 depicts the central pressure of a hurricane as measured in millibars (mb) and maximum wind speed in knots. Lower central pressure generally indicates a more intense hurricane, with stronger winds and more severe effects. The second row in Chart 3 indicates some fluctuations in pressure and maximum wind speed over the 20th century, with reductions in central pressure speed occurring in the 1960s and reductions in wind speed occurring in the 1970s. Maximum central pressure in the 2010s was approximately 965 mb and average wind speed was slightly above 100 mph. Despite these decadal time-scale fluctuations in intensity indicators, there exist no obvious long-term trends.
Given the introduction of satellite monitoring in the 1970s, hurricanes toward the earlier end of the time horizon examined are likely undercounted. For example, while Florida is now heavily populated, it was only sparsely populated before 1900, with Miami having 444 citizens when it was incorporated in 1896.REF Regardless, as shown in Chart 3, there has been little to no trend in hurricane activity since the mid-1800s.
The ACE Index: Another Measure of Hurricane Intensity. Apart from central pressure and maximum wind speeds, another useful metric for quantifying the intensity of hurricanes is the accumulated cyclone energy (ACE) index.REF Created by William Gray and his associates at Colorado State University, the ACE index takes into account the number, duration, and strength of all tropical storms and hurricanes in each ocean basin during the year. Chart 4 depicts the ACE index for the Atlantic Ocean.
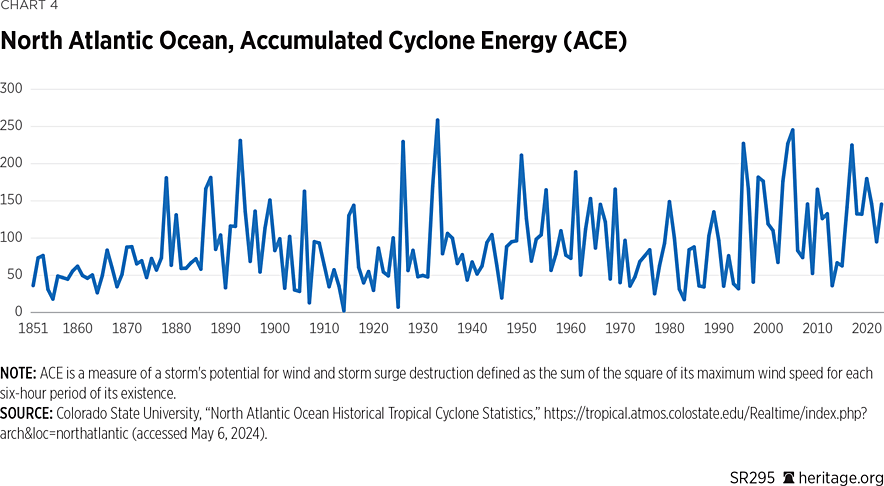
As is apparent in Chart 4, the ACE index in the Atlantic Basin shows a cyclical pattern behavior with spikes in 1893, 1926, 1933, and 1950, and then again in 1995, 2004, 2005, and 2017. Again, measurements of the incidence and severity of hurricanes in earlier years are likely understated as improved satellite technology has enabled more accurate reporting. Although there have been fluctuations over the past two centuries, there have been no notable increases in total hurricane activity in recent years, despite 20th-century and 21st-century increases in global temperatures. ACE data for other regions throughout the globe presented in the appendix also exhibit the same phenomenon, with no discernible trends.
An Analysis of the Damage Caused by Hurricanes
Undoubtedly, hurricanes damage property. Table 1 lists the top 30 most costly hurricanes over the twentieth and twenty-first centuries according to the NOAA.REF
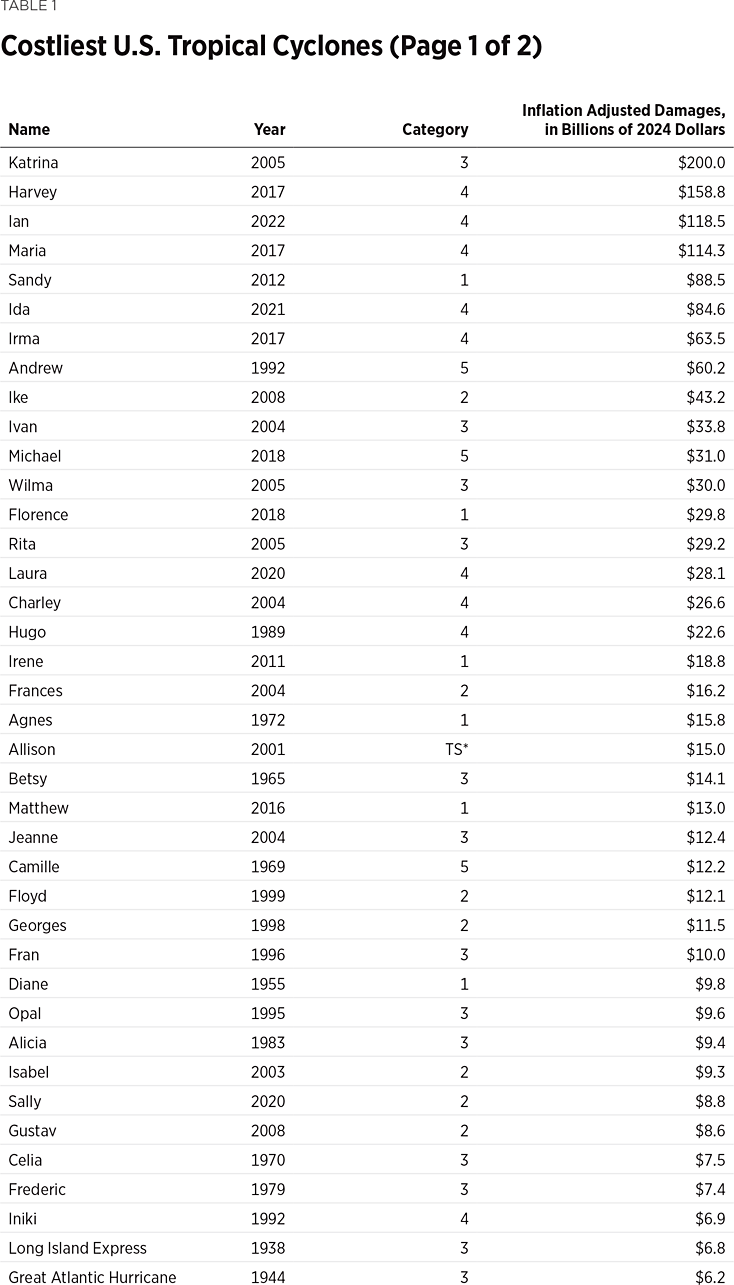
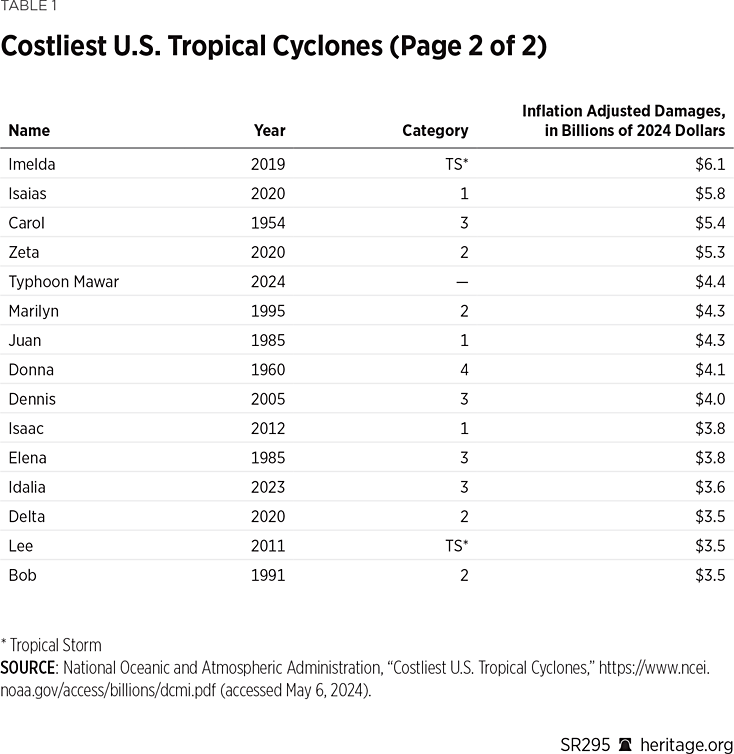
As Table 1 illustrates, the seven most damaging hurricanes in the twentieth and twenty-first centuries have all occurred since 2000. Hurricane Katrina in 2005 was the most devastating hurricane in history, wreaking $200 billion in damages (2024 dollars), followed by Hurricanes Harvey in 2017, Ian in 2022, Maria in 2017, and Sandy in 2012 ($158.8 billion, $118.5 billion, $114.3 billion, and $88.5 billion, respectively). Texas and Florida were hit particularly hard during the 2017 season following the landfalls of Hurricanes Harvey and Irma with total economic damages from those two storms exceeding $200 billion. Of the 30 most damaging hurricanes since 1851, 20 have occurred in the 21st century. However, other major hurricanes, including Hurricane Hugo in 1989 ($22.6 billion) and Hurricane Betsy in 1965 ($14.1 billion) are among the top 30 most damaging hurricanes, as well.
Of course, as population and incomes in the United States, including in coastal locations, have increased, there has also been a concomitant growth in exposure and vulnerability of coastal property in many of these regions. According to U.S. Census data, in July 1971 approximately 1.3 million inhabitants in Miami-Dade County lived in 473,200 housing units.REF By 2022, these numbers had grown to more than 2.6 million inhabitants in more than 1.1 million housing units.REF Along with population growth comes all the housing and infrastructure needed to support that population. Growth in this and other coastal population centers and exposure to landfalling storms is likely to continue in the future, and when hurricane landfalls do occur, damages and costs will likely be greater than before.
As a result, comparing economic damages across different time periods is akin to comparing apples to oranges; areas that have seen income growth will almost surely incur more damages. A recent paper in the journal Nature Sustainability by Jessica Weinkle et al. sought to statistically normalize this growth to better enable direct comparisons across time periods.REF Chart 5, based on analysis from this paper, depicts the trends in damage losses incurred by hurricanes that struck the continental United States after adjustment for increases in wealth, population, and inflation.
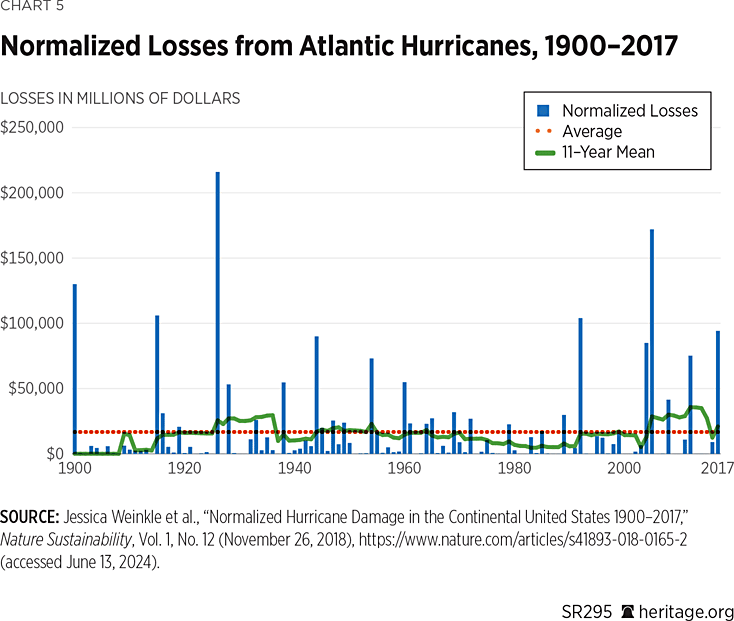
As Chart 5 illustrates, upon normalization, there is no meaningful trend in hurricane losses over time. These results suggest that although the raw dollar amount of damages has increased, these damages are not meaningful with respect to broader economic growth.
What Does Influence the Incidence and Severity of Hurricanes?
If there have been no meaningful increases in hurricanes in modern times related to global temperatures, a key question remains: What has been influencing their incidence and severity? Many natural climatic factors involving oceanic temperatures, such as El Niño and La Niña, as well longer-term cycles, such as the Pacific Decadal Oscillation (PDO) and the Atlantic Multidecadal Oscillation (AMO), have the capacity to significantly influence the incidence and severity of hurricanes in particular localities.
ENSO Effects. The El Niño-Southern Oscillation (ENSO) cycle is a natural climate cycle consisting of alternating periods of warming and cooling in the central and eastern parts of the Pacific Ocean near the Equator.">REF ENSO contributes significantly to climate variability, including hurricane incidence and severity. El Niño and La Niña are complementary climate phenomena that influence global weather patterns comprising ENSO. El Niño is the warm phase of ENSO and is characterized by a significant increase in sea surface temperature (SST) across the central and eastern equatorial Pacific Ocean. El Niño events can manifest themselves in differing ways in various regions across the globe. For example, El Niño has the capacity to lead to wetter conditions in the Southwestern United States and parts of South America, and drier conditions in Australia and Southeast Asia.
La Niña, on the other hand, is the cool phase of ENSO, characterized by colder oceanic temperatures in the central and eastern equatorial Pacific, having effects complimentary to its El Niño counterpart. For example, La Niña is often associated with increased rainfall in Australia and Southeast Asia, cooler than average temperatures in the Pacific Northwest of the United States, and dryer and warmer conditions in the Southwest U.S.
It has been long established that El Niño and La Niña can influence the incidence and severity of hurricanes. For example, a 1984 study found that of the 54 major hurricanes striking the U.S between 1900 and 1983, only four occurred in 16 El Niño years, in contrast to 50 making landfall during the 68 non–El Niño years, making hurricanes almost three times more likely during el Nino years.REF Subsequent research found a 71 percent greater chance of an effect on the U.S. East Coast in La Niña years than El Niño years.REF A significant body of other literature also notes the inherent relationship between ENSO cycles and the incidence and severity of hurricanes.REF These variations are not much related to temperature, but instead to wind shear conditions, with increased wind shear in the Atlantic basin in El Niño years suppressing hurricane activity, despite warmer-than-average temperatures.
Longer-Term Trends. In addition to ENSO cycles, two longer-term trends also influence hurricane development, namely the Atlantic and Pacific Multidecadal Oscillation.
The Atlantic Multidecadal Oscillation (AMO). The AMO is a climate cycle affecting the SST of the North Atlantic Ocean. Measured in terms of SST anomalies (temperature differences with respect to an a priori–specified baseline temperature), the AMO has warm and cool phases lasting approximately two decades to four decades.REF During the warm phase, the North Atlantic SST is higher, which can lead to increased hurricane activity and warmer temperatures in the Northern Hemisphere. Chart 6 depicts the annual Atlantic Basin ACE index and annual AMO.
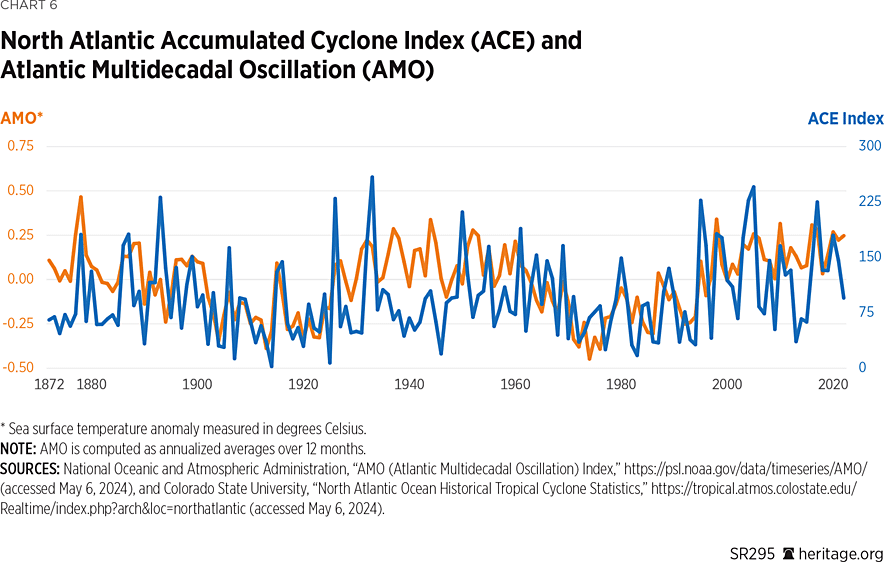
As Chart 6 illustrates, since the 1800s, the ACE index/AMO link is much clearer and more compelling than any purported links between global temperature increases and hurricane frequency or severity. There has also been a significant amount of peer reviewed research discussing this link.REF
The Pacific Decadal Oscillation (PDO). The PDO, on the other hand, is a similar phenomenon characterizing SST variability across the northern Pacific Ocean.REF When ocean temperatures are unusually cool in the central North Pacific and warmer near the Pacific Coast, the PDO is in a positive phase, which tends to support El Niño conditions. Conversely, when the pattern is reversed, with warmer temperatures in the central Pacific and cooler temperatures along the North American coast, the PDO shifts to a negative phase, favoring La Niña conditions.REF The PDO influences weather and climate patterns across the Pacific, ultimately affecting precipitation and temperature patterns in North America along with the intensity of El Niño and La Niña events, including hurricanes.
In particular, when El Niño events and the warmer PDO are present, more storms develop in the Eastern Pacific, and hurricanes become more likely in these regions. Downstream, the atmosphere over the tropical North Atlantic and Caribbean are observed to have increased stability and higher tropospheric vertical shear due to increased westerlies in the higher levels in the Atlantic Main Development region, reducing hurricane activity there. Chart 7 depicts the relationship between the PDO and the ACE index for the Northwest Pacific Ocean.
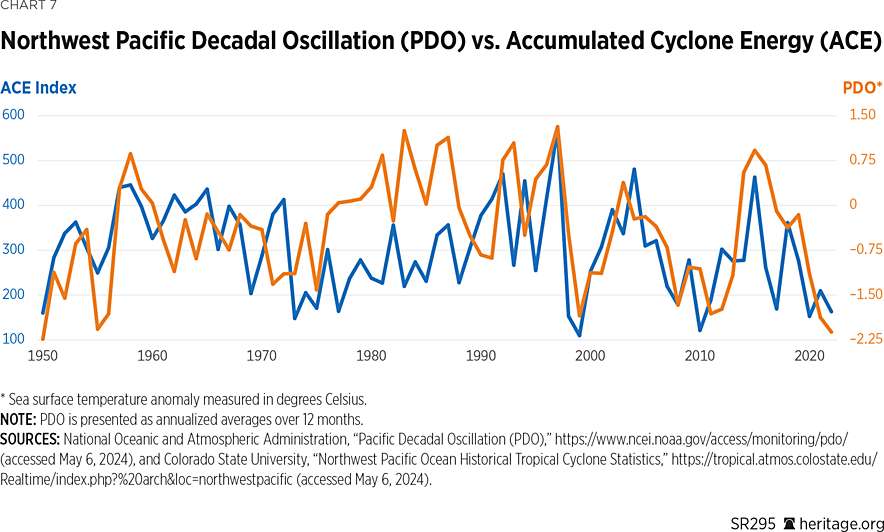
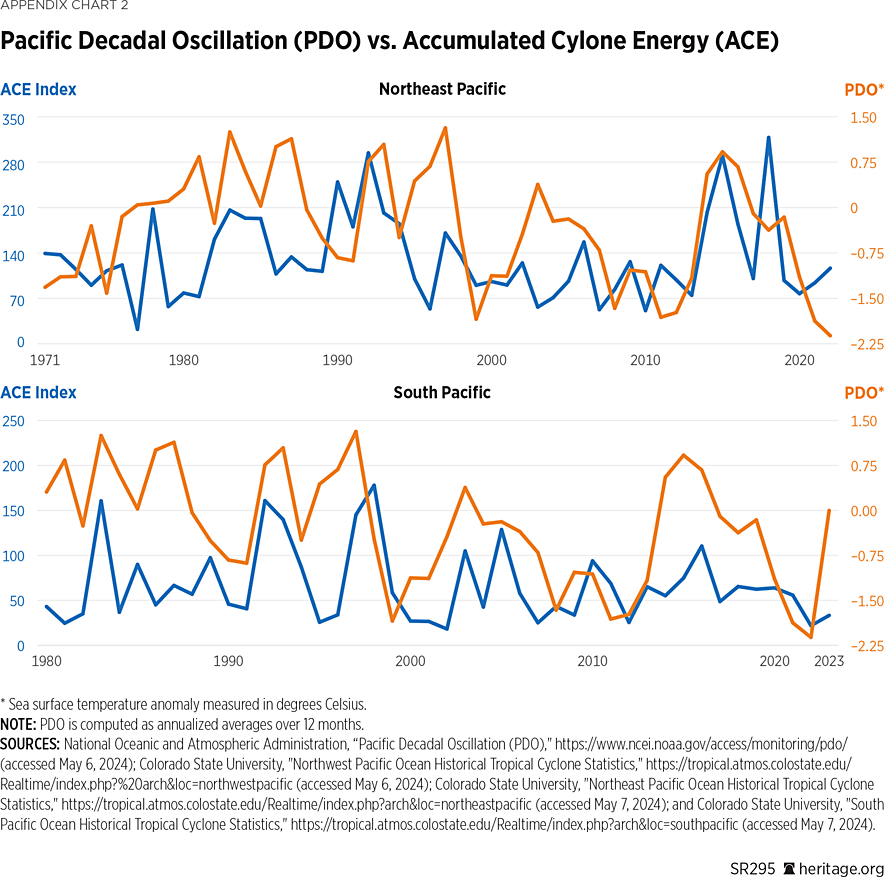
As shown in Chart 7, there is a clear and consistent relationship between the PDO and the ACE index in the northwest Pacific Ocean.REF Appendix Charts 2, 3, and 4 compare PDO to ACE indices for other regions within the Pacific as well. This relationship has also been discussed in the peer-reviewed literature as well.REF
Altogether, both the AMO and PDO are significant because they affect the global climate system and can modulate the effects of global warming on regional climates. Understanding these phenomena is crucial not only for accurate climate modeling and prediction, but also for attribution of hurricane activity to human versus natural influences.
Conclusion
As this Special Report illustrates, regardless of increases in global temperatures, there have been no commensurate increases in hurricane frequency and intensity over the past century. Furthermore, although damages caused by hurricanes have increased over time, these damages are a natural consequence of economic development, and essentially disappear when normalized with respect to economic growth. Cyclical changes in hurricane activity are much more adequately explained by natural factors, such as El Niño, La Niña, the Atlantic Multidecadal Oscillation, and the Pacific Decadal Oscillation.
Lawmakers and the general public should separate data-driven conclusions from politicized attributions and statements. This Special Report seeks to support this goal.
Joe D’Aleo, Visting Fellow in the Center for Energy, Climate, and Environment at The Heritage Foundation, is Executive Director of Icecap.Us and Co-Chief Meteorologist at Weatherbell Analytics, LLC. Kevin D. Dayaratna, PhD, is Chief Statistician, Data Scientist, and Senior Research Fellow in the Center for Data Analysis at The Heritage Foundation. The authors gratefully acknowledge the help of Heritage Domestic Policy Research Assistant Andrew Weiss and Hope Canlas, a member of the summer 2024 Heritage Young Leaders Program.
Appendix
Appendix Chart 1 depicts the frequency of hurricanes specifically for Florida and Texas, two states known for being the target of major hurricanes. These states also elicit no notable trend.
Appendix Chart 2 depicts the PDO in the Northwest, Northeast, and Southern Pacific Association with the ACE index. As is the case with Chart 6 in the body of the Special Report, the relationship between the two measures is clear.
