For decades, the health care debate was focused primarily on coverage and the uninsured. The vast majority of Americans now have or have access to health care coverage, either privately or publicly. Today, the health care debate is focused on affordability and access.
This report, using available data, tracks and quantifies key health care trends related to these measures. In brief:
- Premiums continue to climb,
- Provider access is more restricted, and
- Choice of plans remains lower.
Without change, these trends are likely to continue, further undermining access to and the affordability of health care for millions of Americans.
Background
The key elements of the Affordable Care Act (ACA)—also known as Obamacare—took effect in 2014, thus making 2024 the law’s tenth year of operation. The ACA’s new regulations and government spending primarily affected two subsets of America’s health insurance system: the private individual (or non-group) health insurance market and the publicly funded (federal and state) Medicaid program.
Prior to Obamacare, the individual health insurance market consisted mainly of workers (and their families) without access to employer-sponsored coverage, often because they were self-employed. Also prior to Obamacare, the Medicaid program covered low-income individuals who were either children, pregnant women, elderly, or disabled.
The ACA focused on insuring low-income uninsured individuals through two mechanisms. The first was expanding Medicaid to cover individuals with incomes below 138 percent of the federal poverty level (FPL) who were not previously eligible for the program. The second was providing individuals with incomes between 100 percent and 400 percent of the FPL with subsidies to purchase government-approved health plans sold through new individual market exchanges.
The effects were the addition of millions of non-elderly, able-bodied adults without dependent children to the Medicaid program and the provision of heavily subsidized individual market coverage to several million more individuals with incomes just above Medicaid eligibility. As a result, more Americans became dependent on government-run health care, while for those who had private individual health insurance before Obamacare, premiums spiked and coverage options shrank.
Recent passage of the so-called Inflation Reduction Act continues the negative trends that have flowed from Obamacare. Billed as an effort to reduce the cost of prescription drugs for Medicare enrollees, the provisions of this act—most notably the introduction of a mechanism for setting government price controls on widely prescribed drugs—have led to higher premiums and fewer choices for seniors.
Higher Cost of Individual Market Health Insurance Under Obamacare
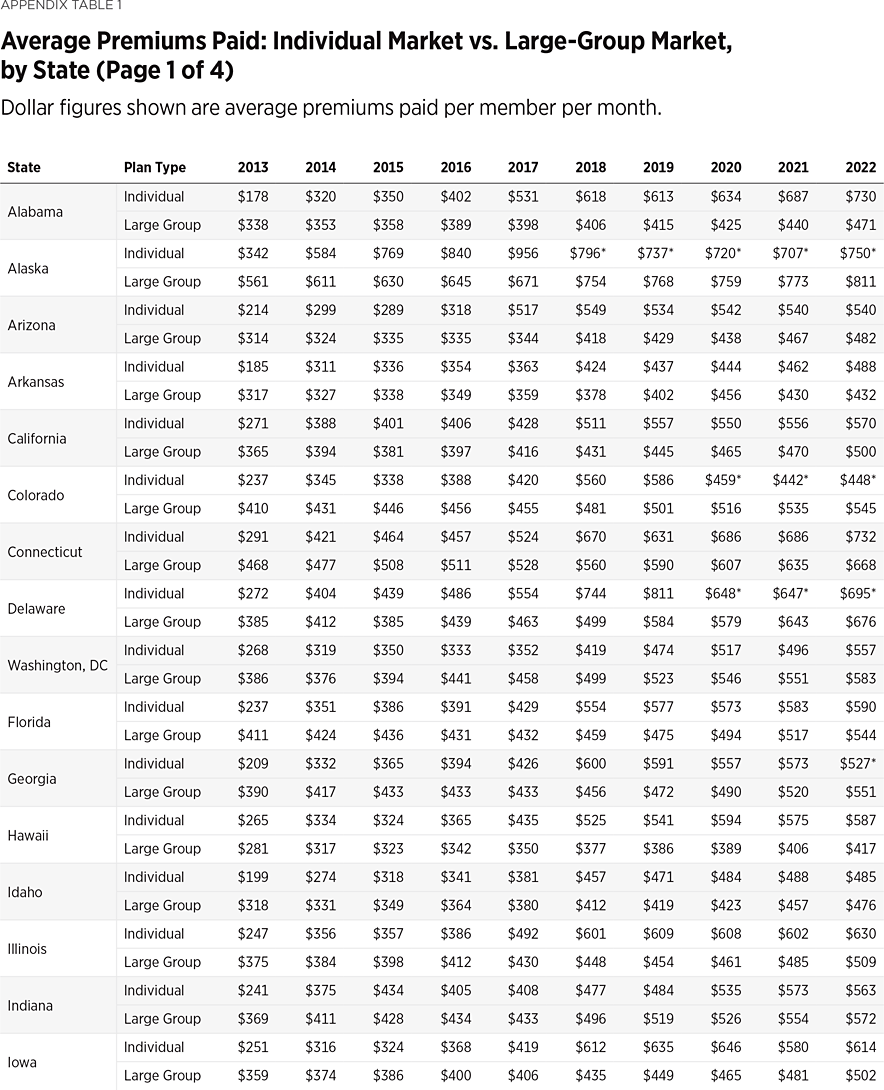
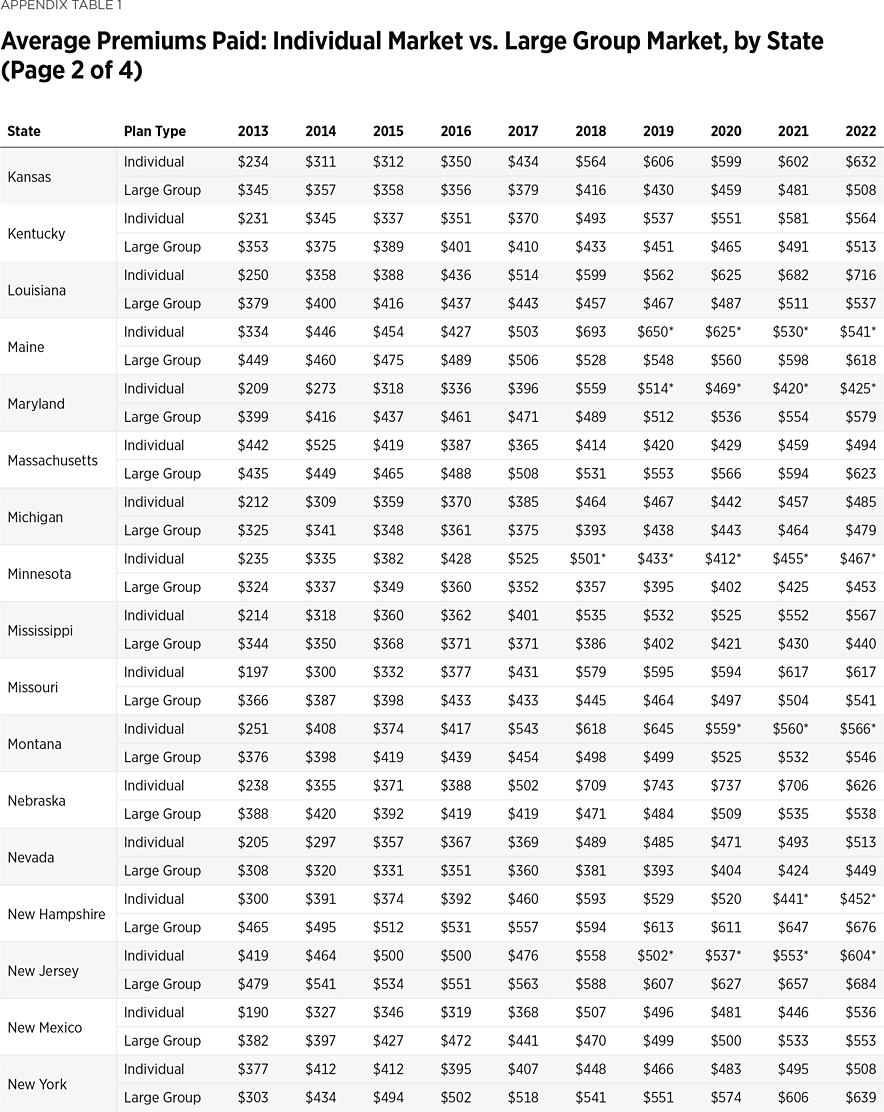
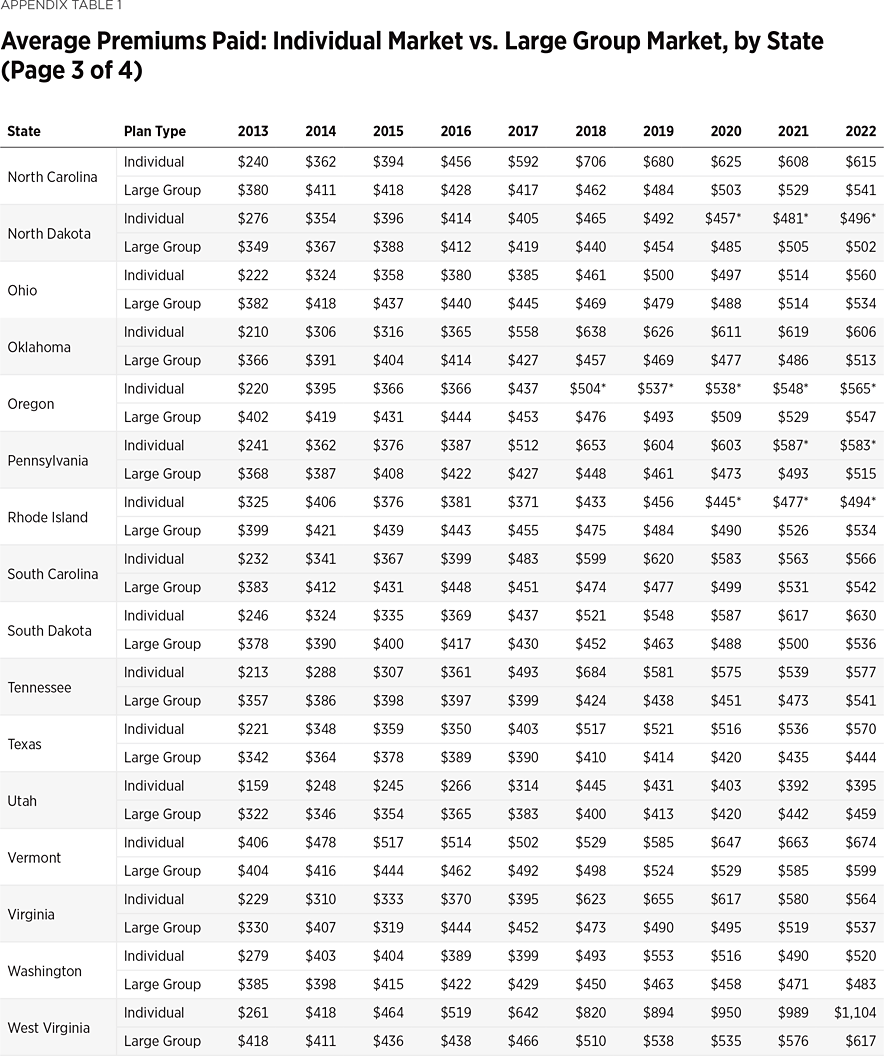
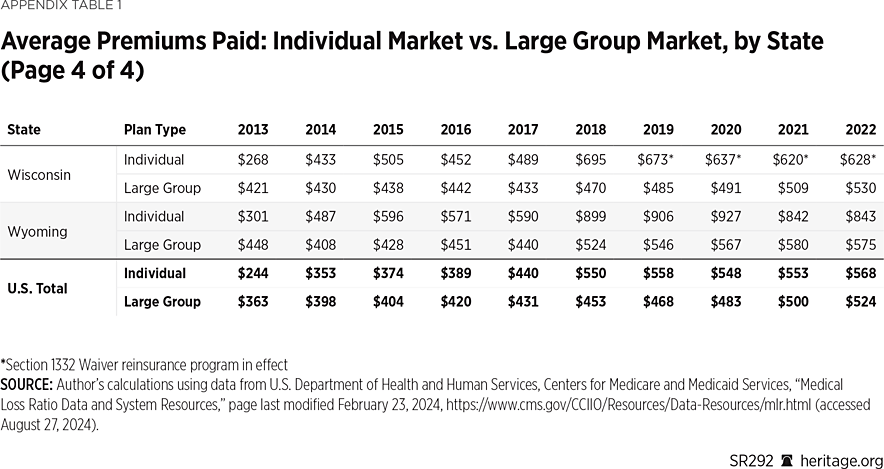
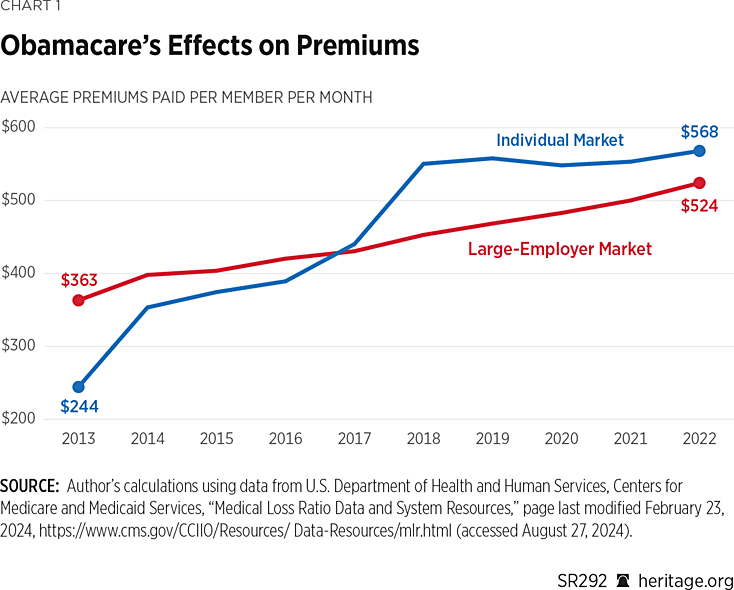
Obamacare increased the cost of individual market health insurance coverage by 133 percent between 2013—the last year before the implementation of Obamacare—and 2022. In 2013, the national average premium paid for individual market coverage was $244 per member per month.REF In 2022, that figure was $568 per member per month. By comparison, for the same period in the large-employer market, national average premiums paid grew by only 44 percent (from $363 to $524 per member per month).REF
Prior to Obamacare, the cost of individual market coverage was less than that for large-employer coverage. However, because Obamacare-driven cost increases in the individual market substantially outpaced cost growth in the rest of the health system, since 2017, per-enrollee coverage costs have been higher in the individual market than in the large-employer market. Furthermore, that is the case despite the fact that in recent years, 15 states have obtained federal waivers from some Obamacare provisions, enabling insurers in those states to reduce premiums.
Changes in coverage costs varied by state. (See Appendix Table 1.) In nearly every state, consumers on average paid more for coverage under the ACA. By 2022, the per-capita average monthly cost of individual market coverage had more than doubled in 40 states—and had more than tripled in Missouri (+213 percent) and more than quadrupled in Alabama (+309 percent) and West Virginia (+323 percent). In contrast, the state with the smallest growth in coverage cost over this period was Massachusetts (+12 percent), but it was also the state that had the highest cost of coverage back in 2013. That was because almost all the ACA’s new mandates and regulations, along with a similar set of income-related subsidies, were already in place in the Massachusetts individual market before the ACA took effect.
Higher Deductibles Under Obamacare
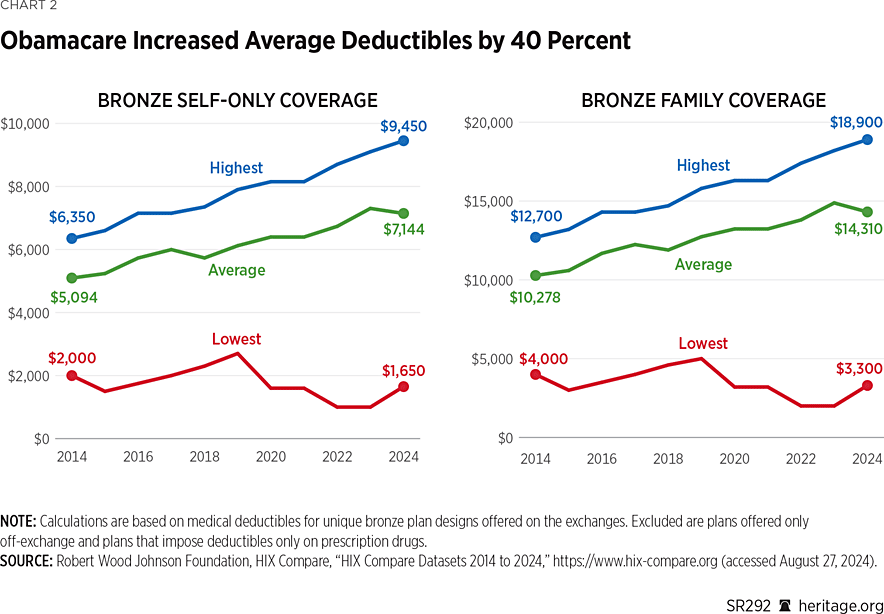
Faced with escalating claims costs for Obamacare coverage, insurers attempted to hold down premiums by raising deductibles. The middle-income self-employed have been particularly hit by Obamacare’s rising deductibles. Because they are self-employed, their coverage options are generally limited to plans that are sold in the individual market. But because Obamacare subsidies are targeted to lower-income individuals, they qualify for little or nothing in ACA premium tax credits and cost-sharing reductions.REF
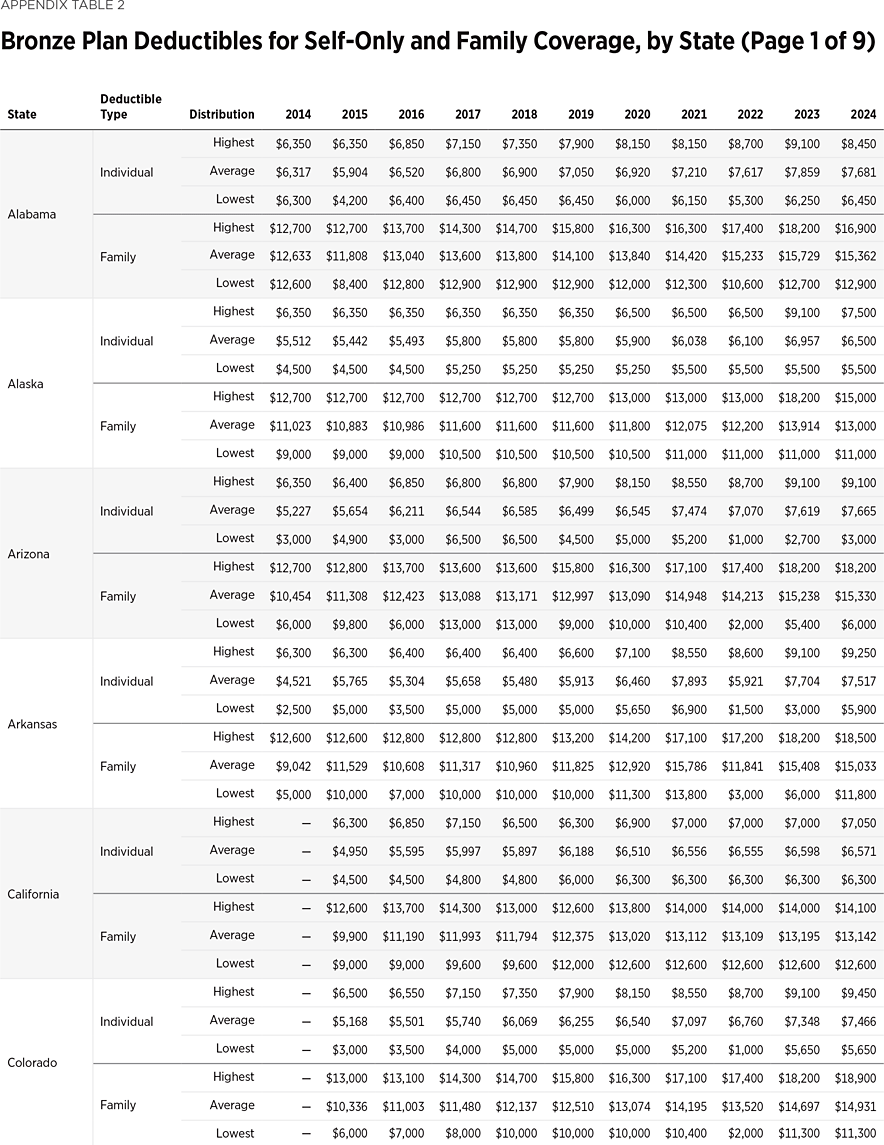
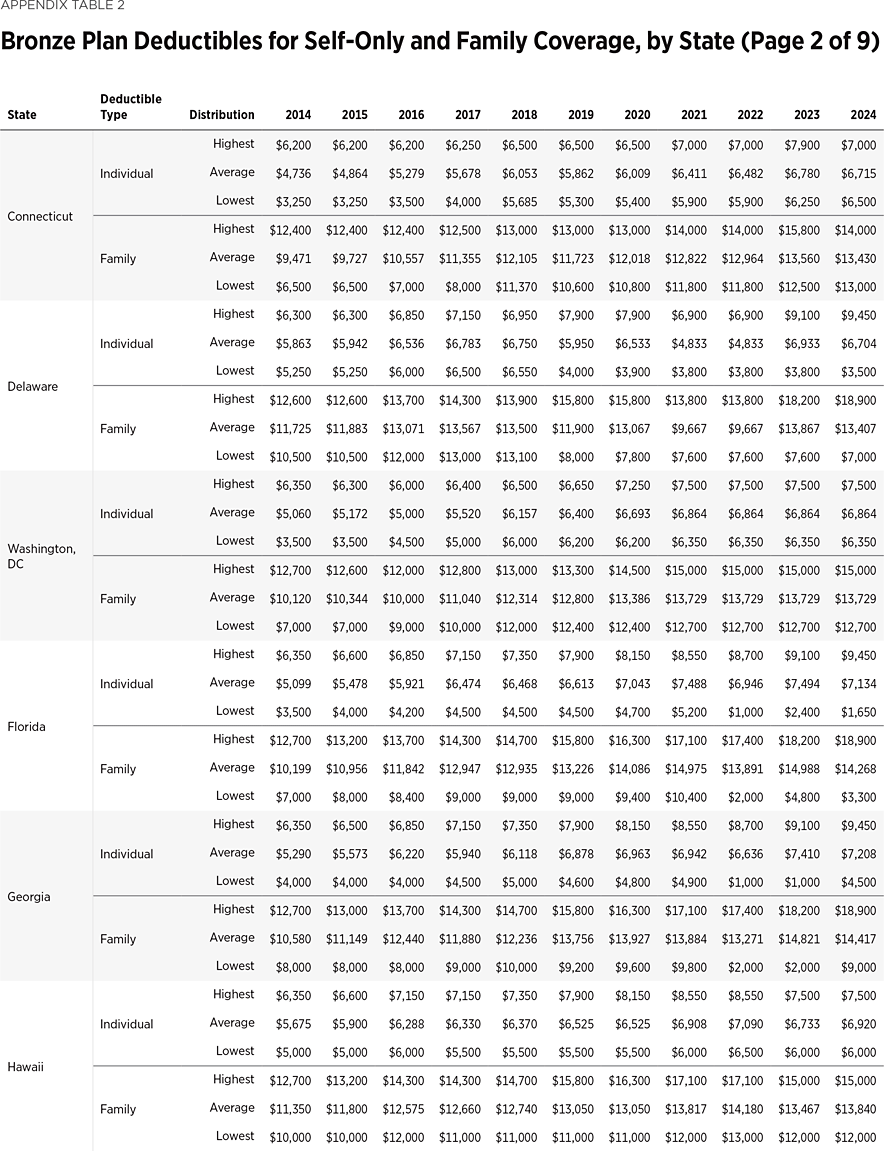
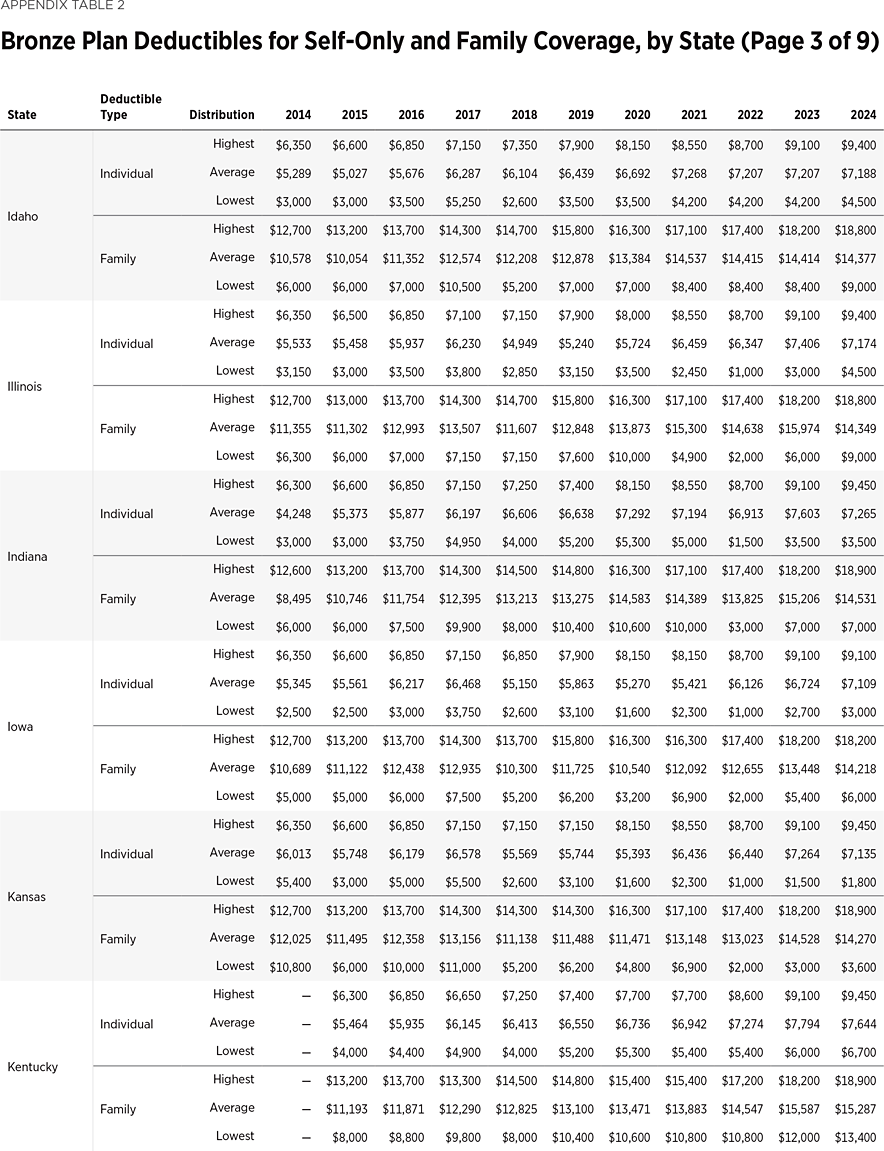
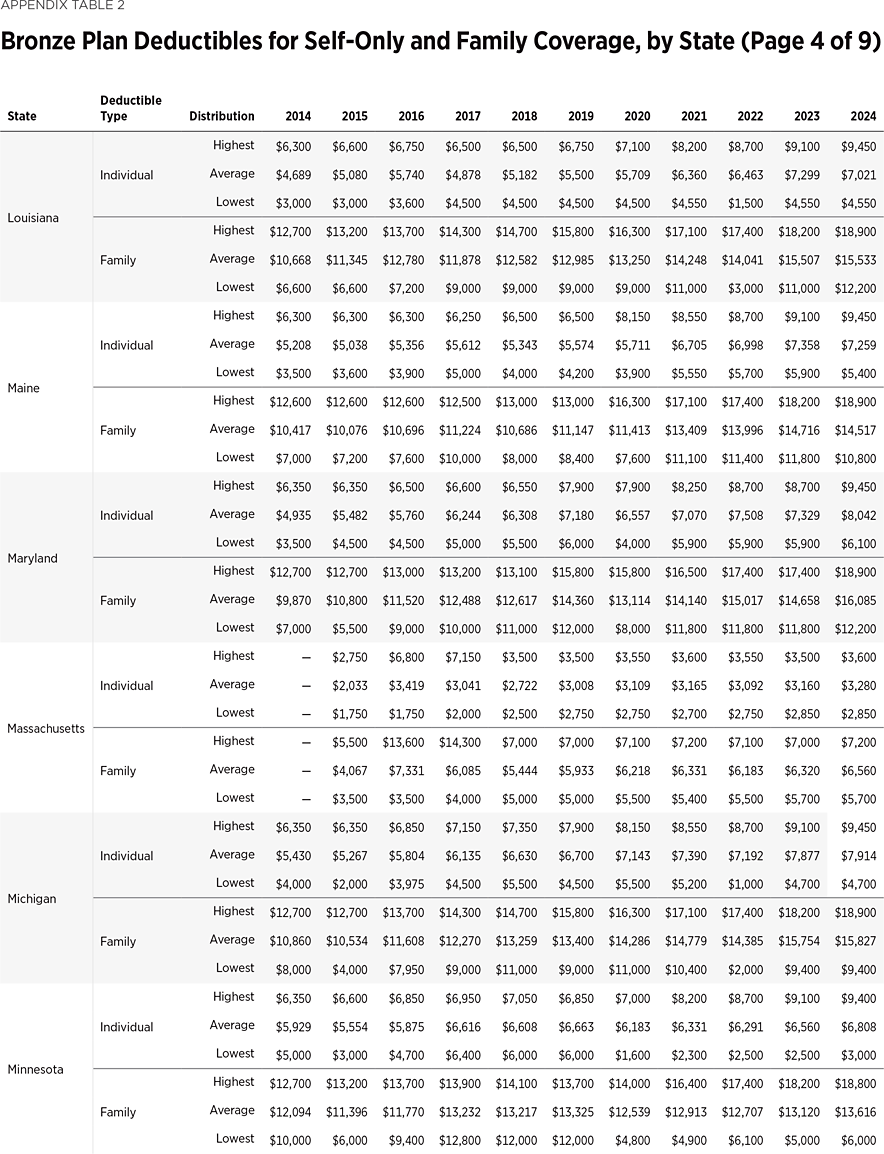
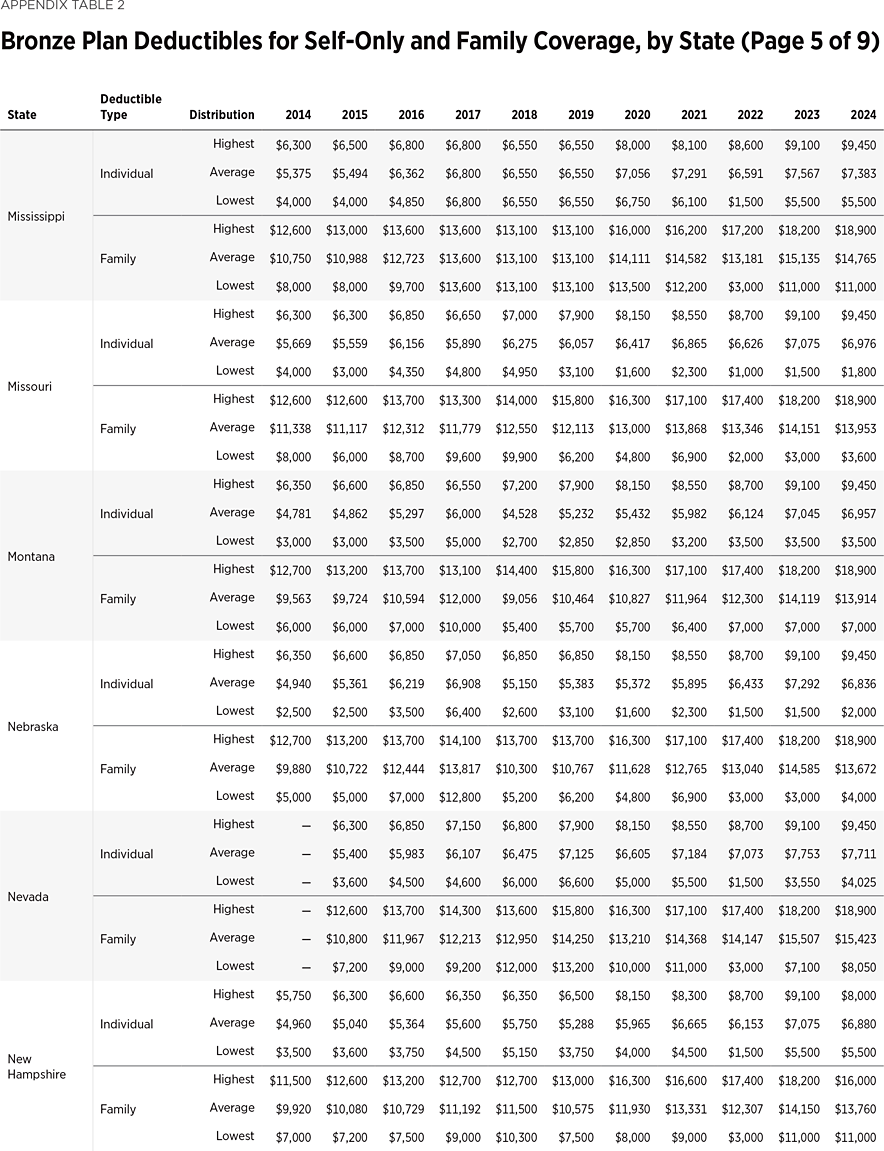
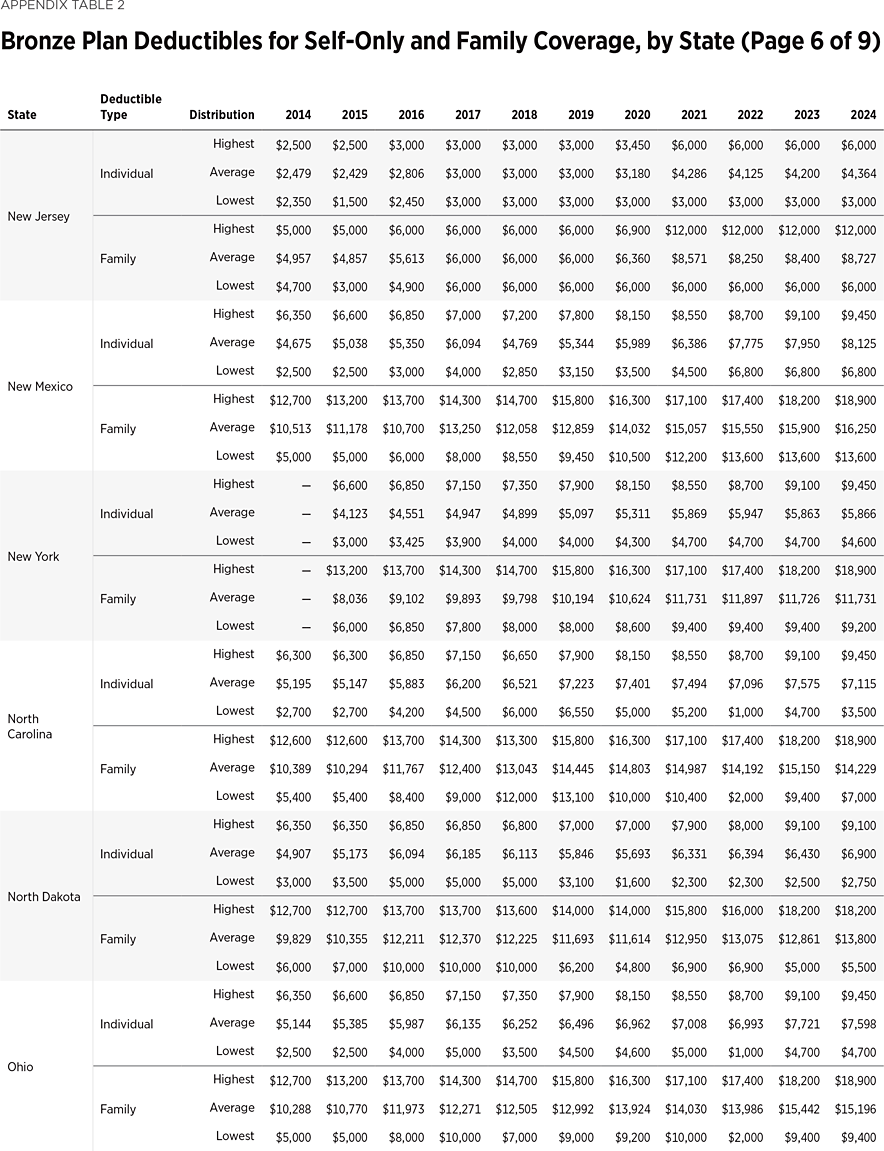
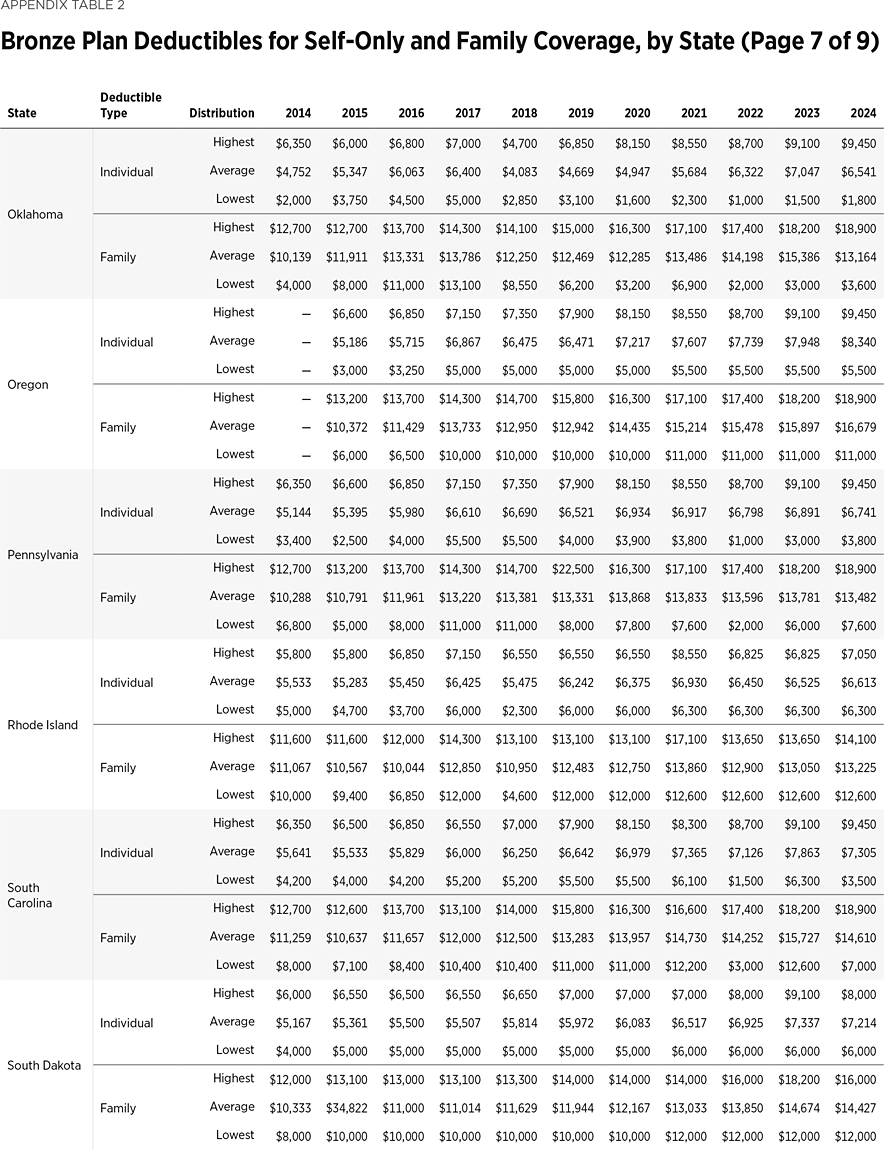
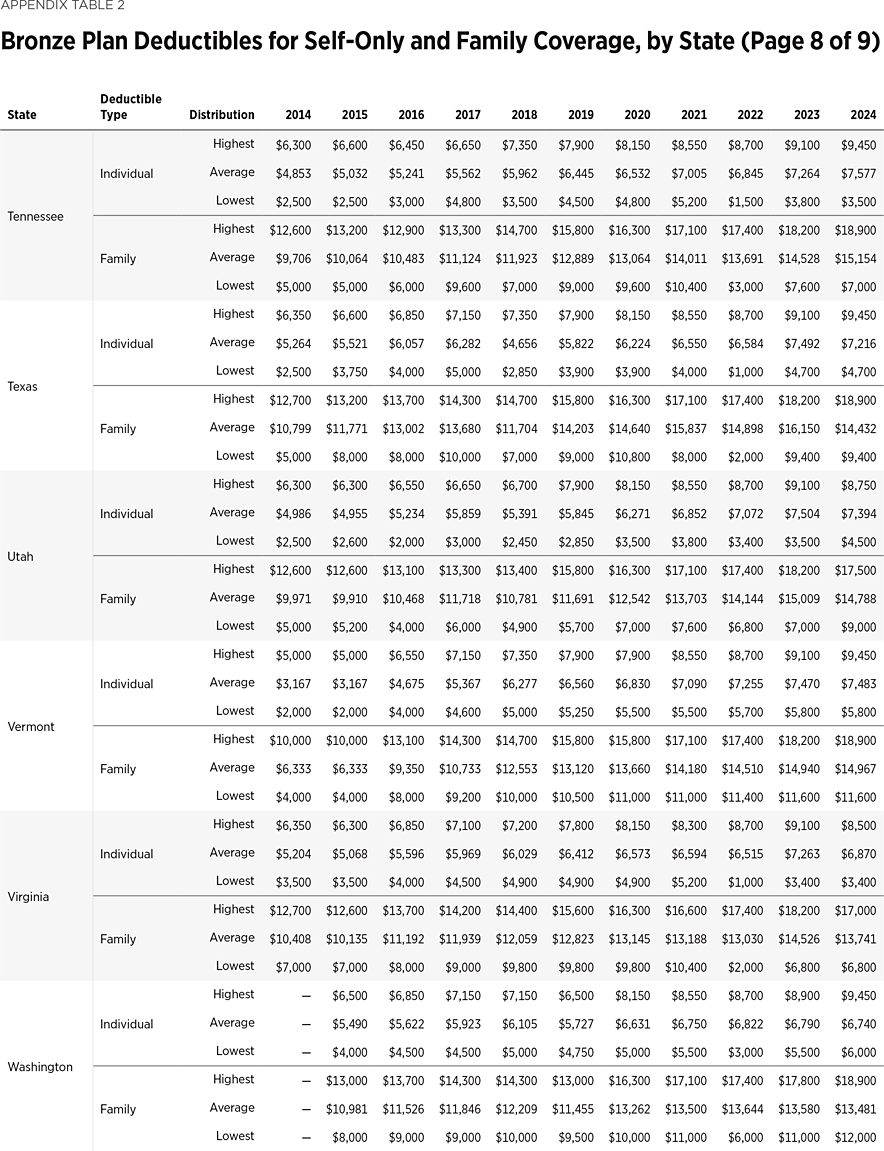
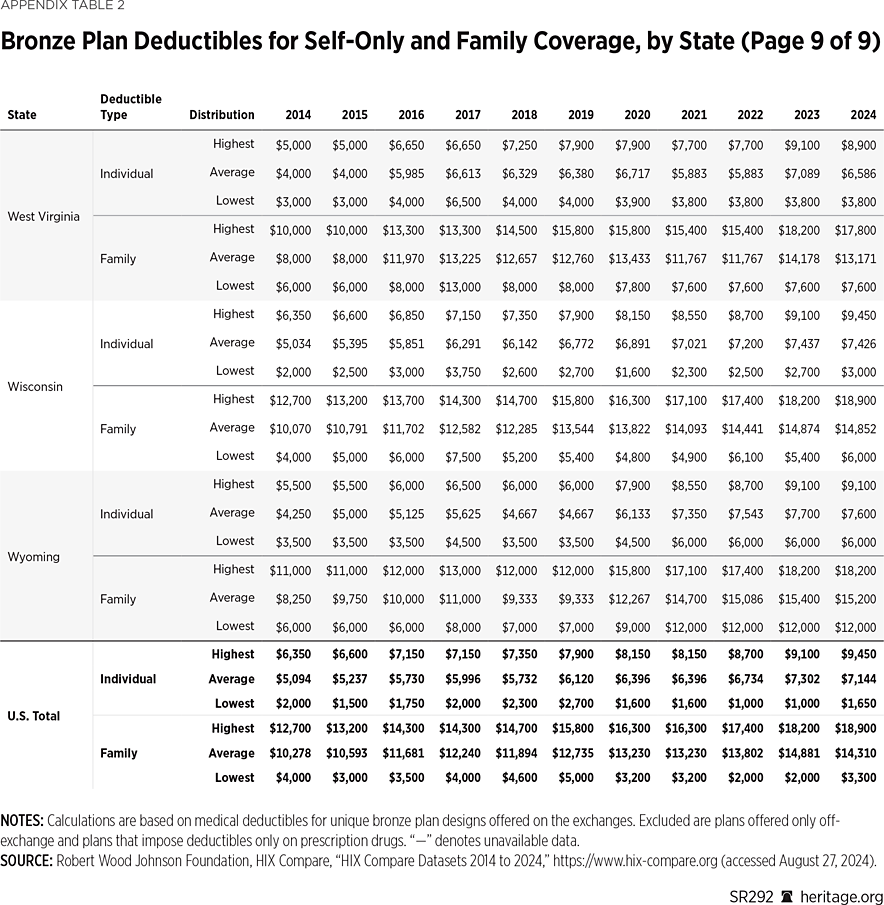
The average deductibles for bronze-level plans sold on the exchanges increased by 40 percent between 2014 and 2024.REF For self-only coverage, the average deductible was $5,094 in 2014 but is $7,144 in 2024, while the average deductible for family coverage has increased from $10,278 in 2014 to $14,310 in 2024.REF
By comparison, the Kaiser Family Foundation’s 2023 Employer Health Benefits Survey reports that the average deductible for self-only coverage among workers enrolled in employer-sponsored “high deductible” plans was $3,552 in firms with fewer than 200 workers and $2,317 in firms with more than 200 workers.REF
In contrast, for 2024, all of the bronze-level exchange plans in 38 states have self-only deductibles greater than $3,000, and in 29 of those states, all of the self-only deductibles for bronze plans are more than $4,000. (See Appendix Table 2.)
Narrower Networks Under Obamacare
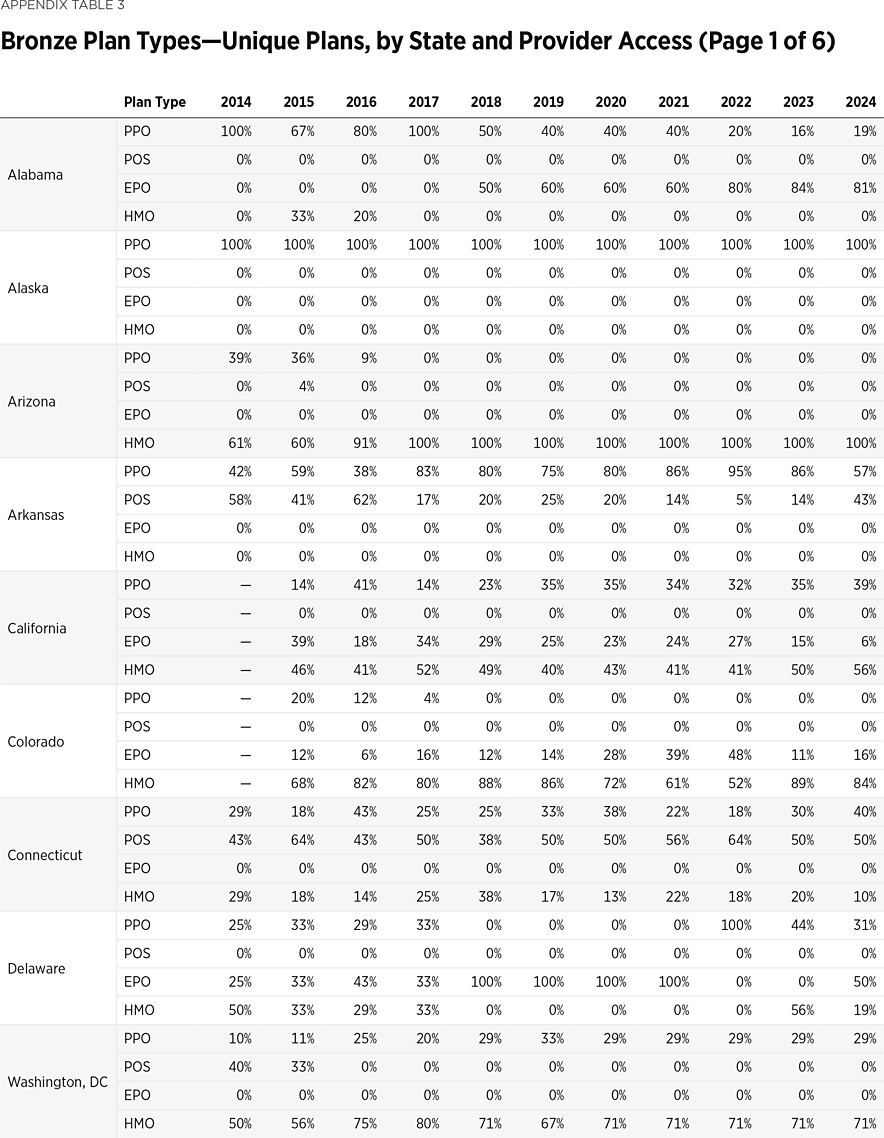
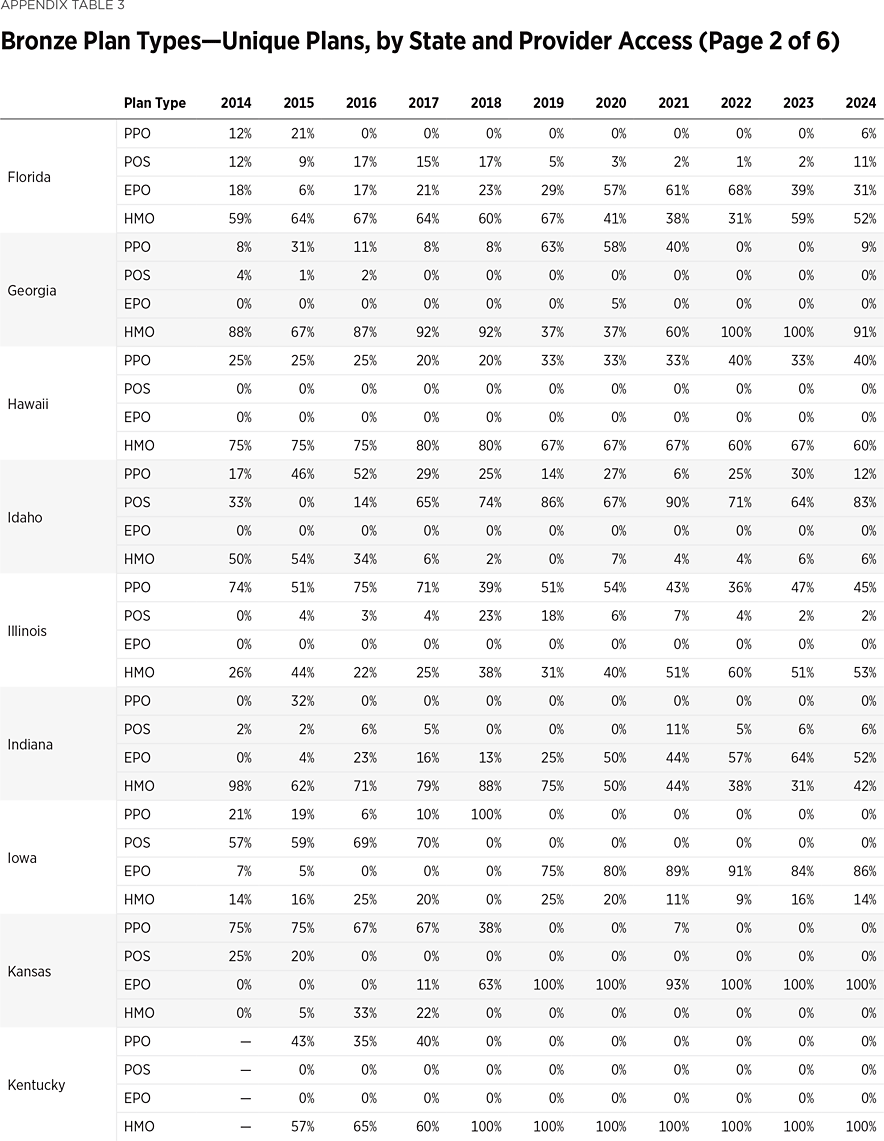
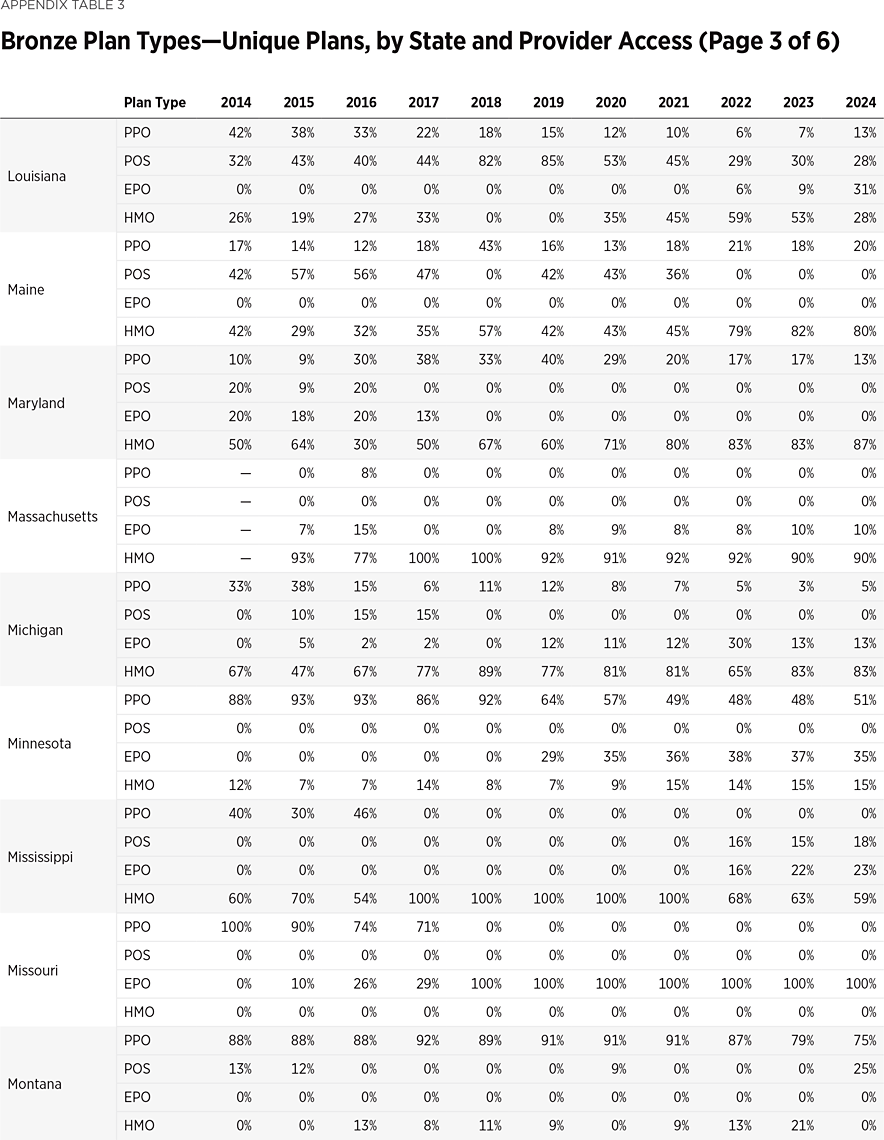
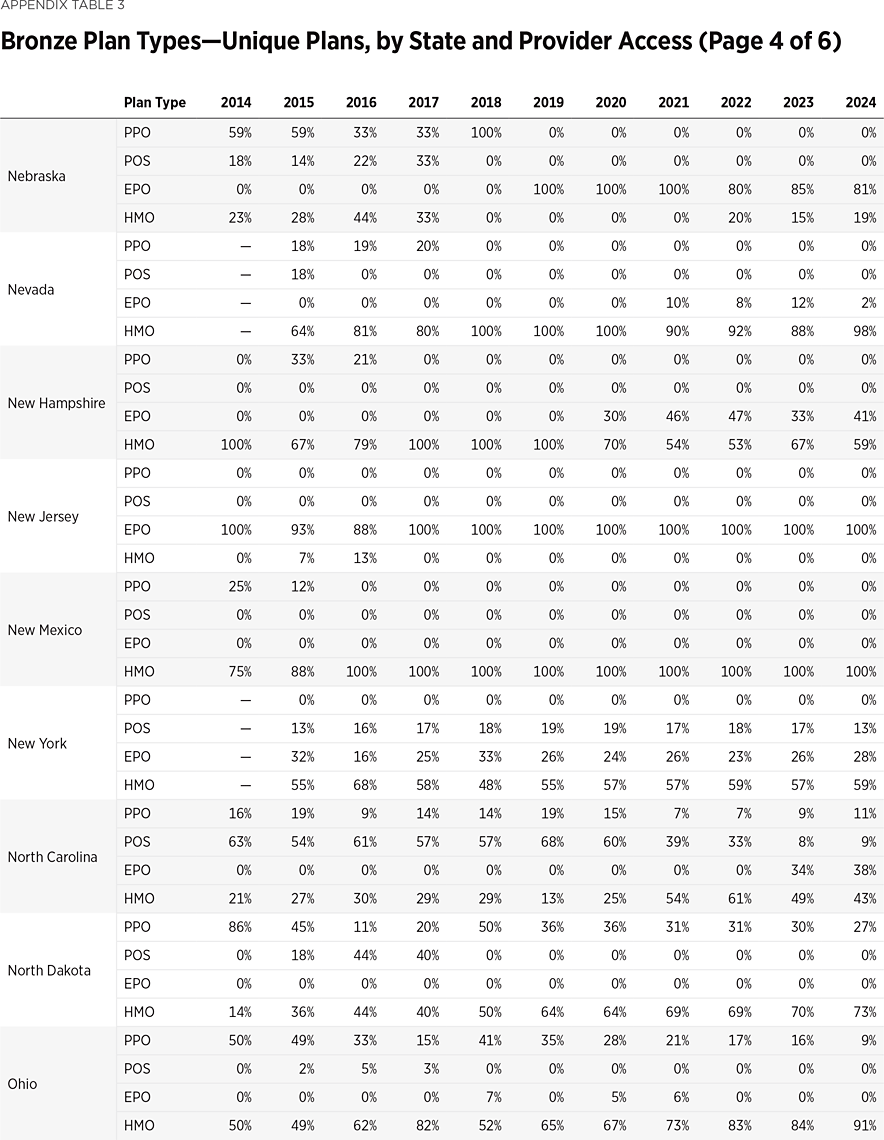
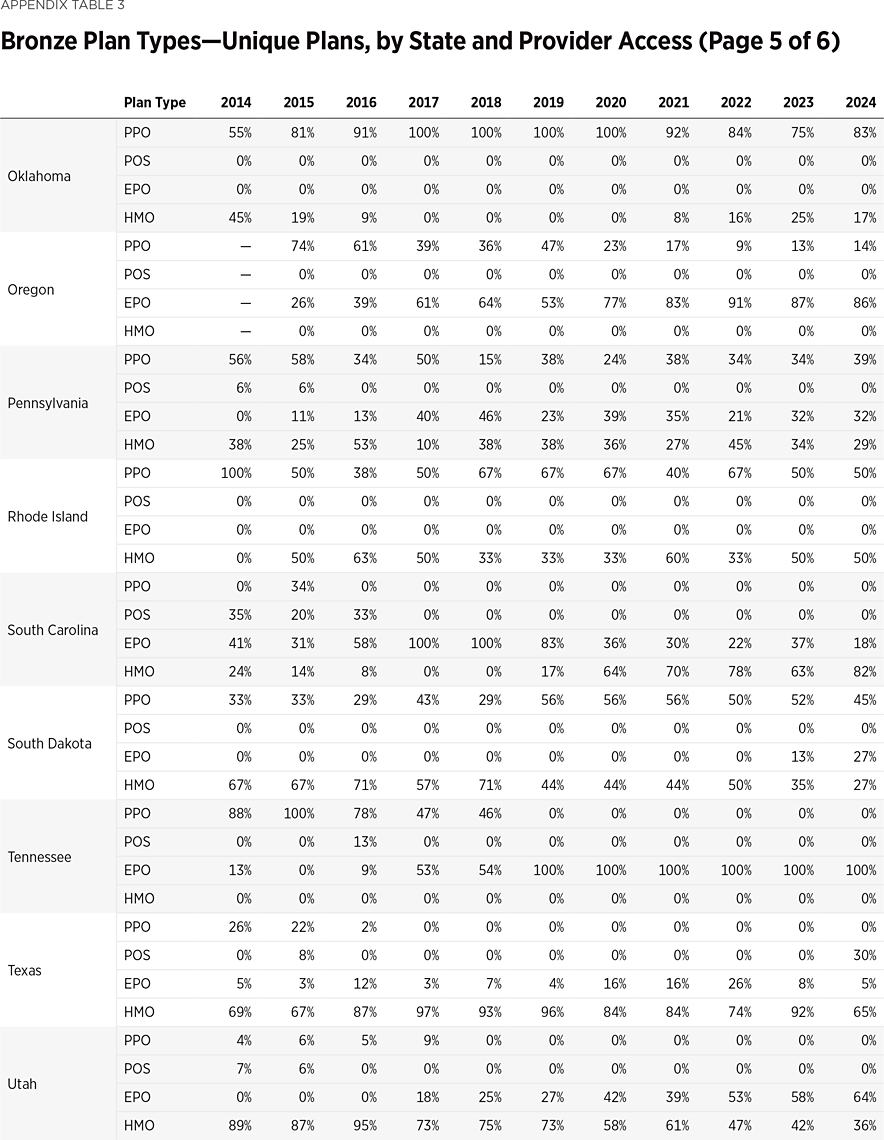
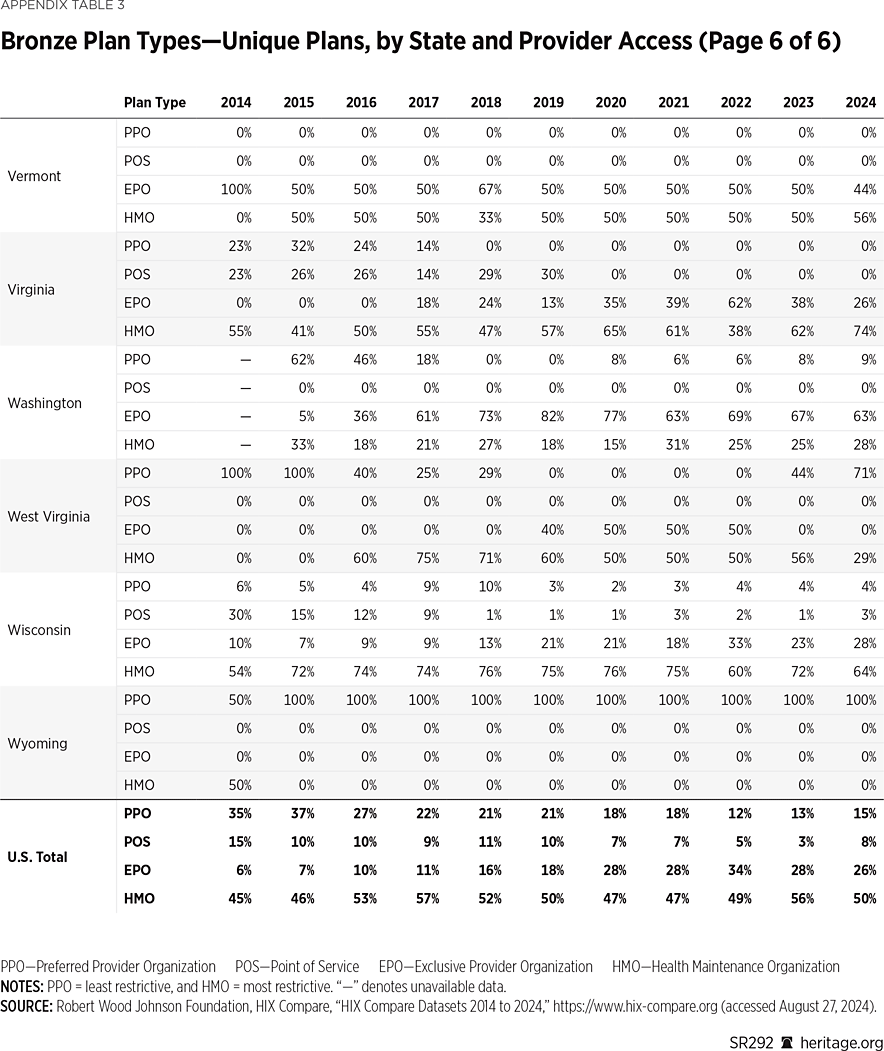
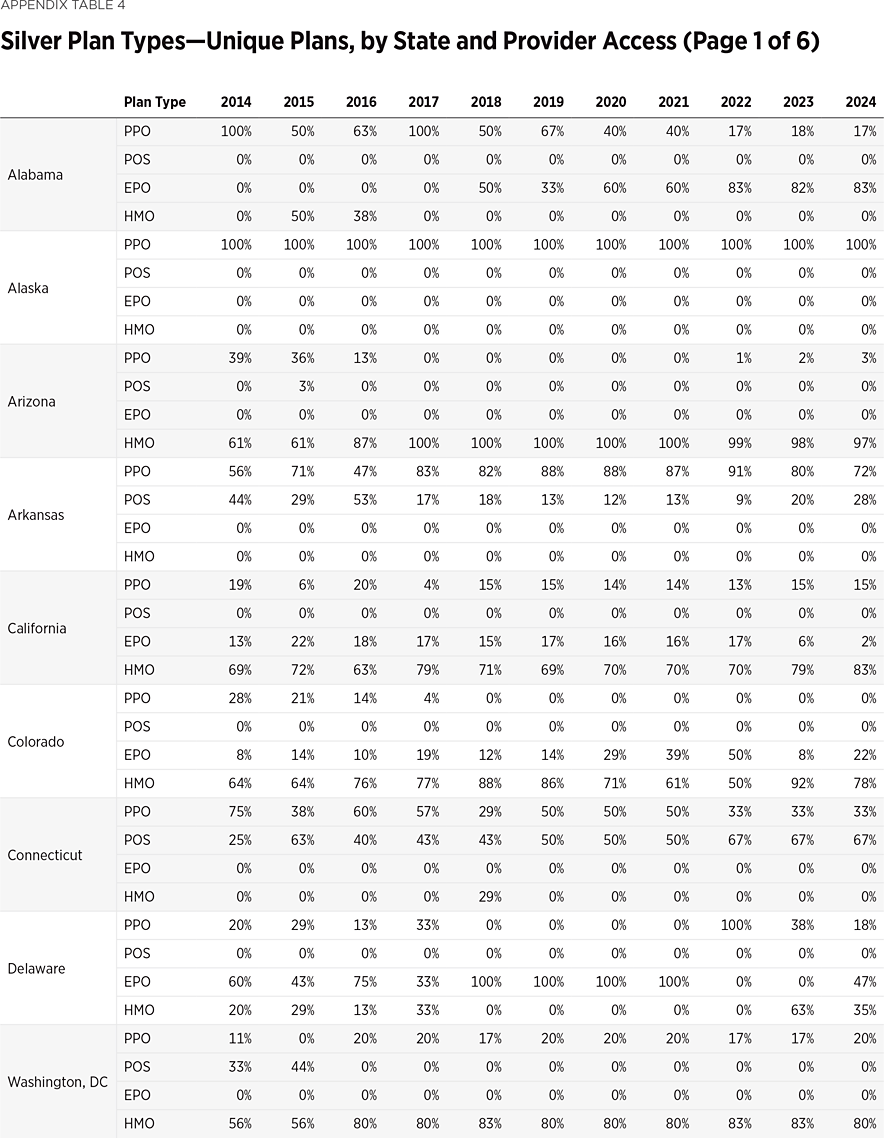
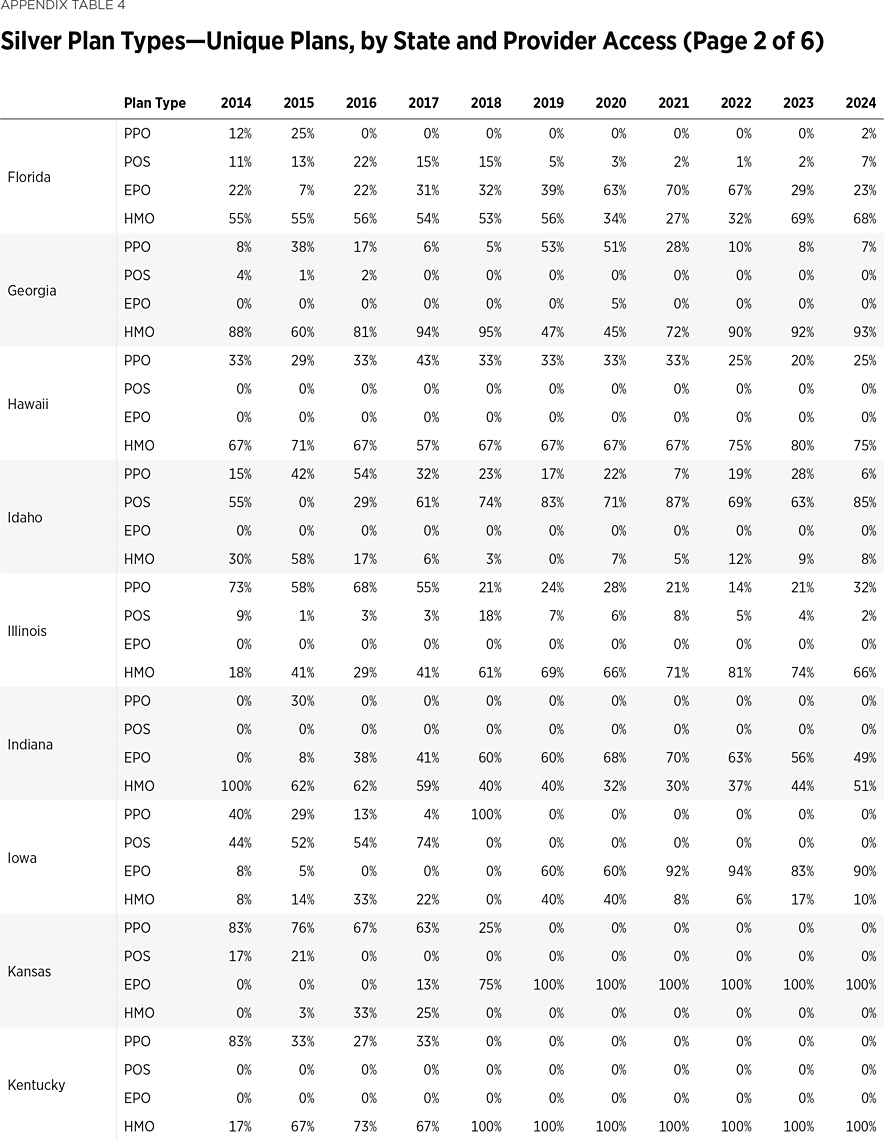
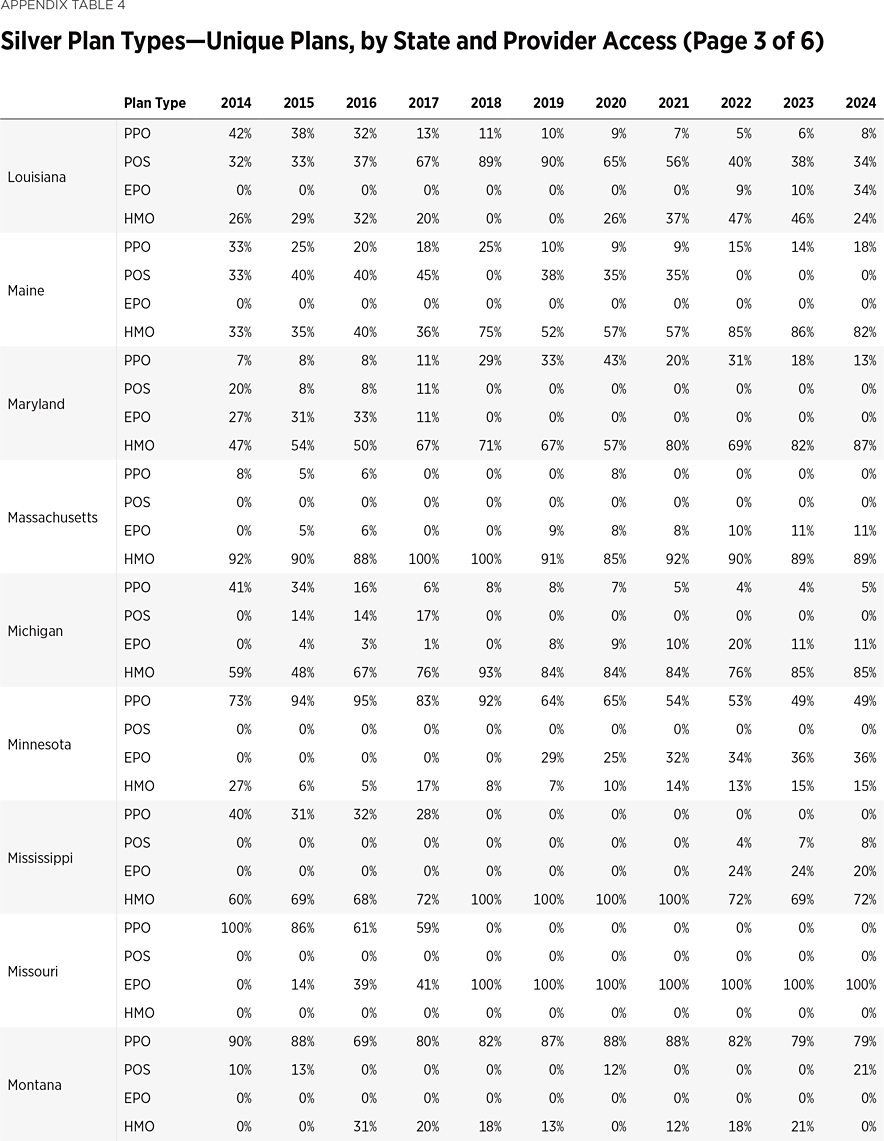
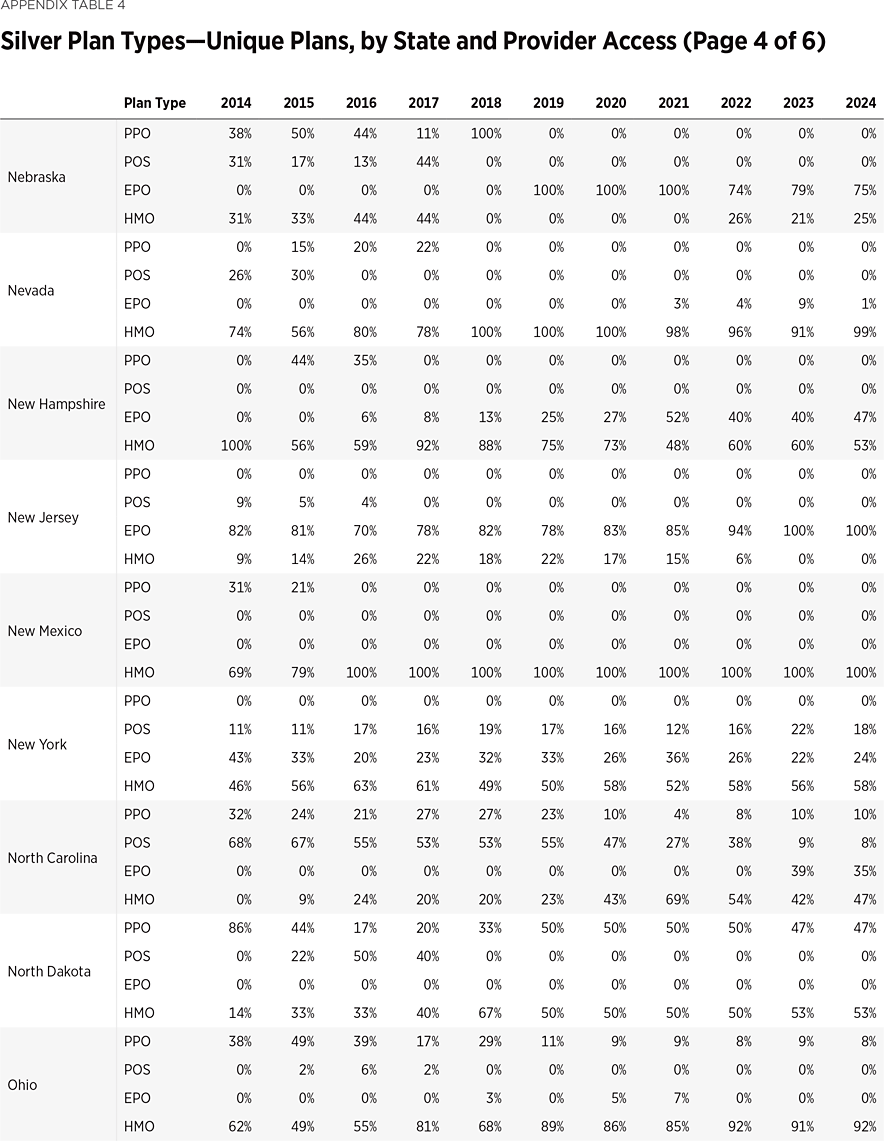
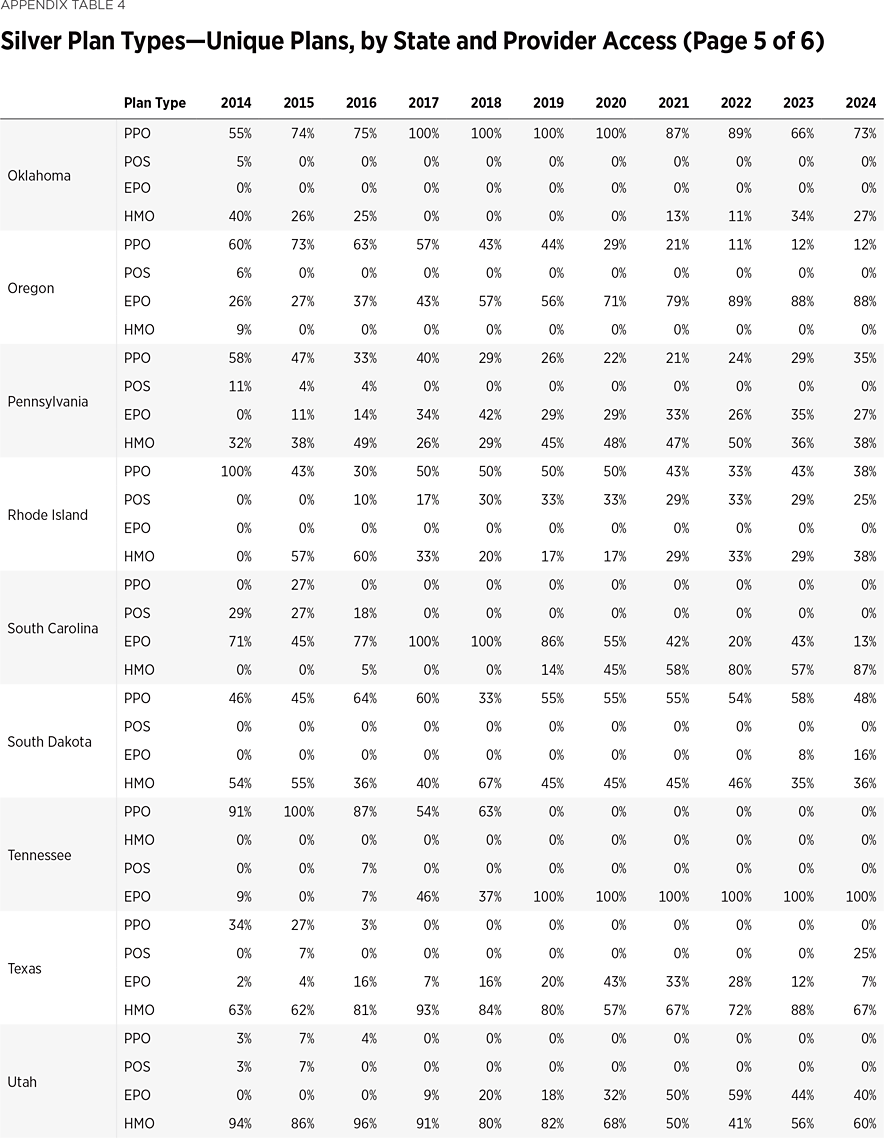
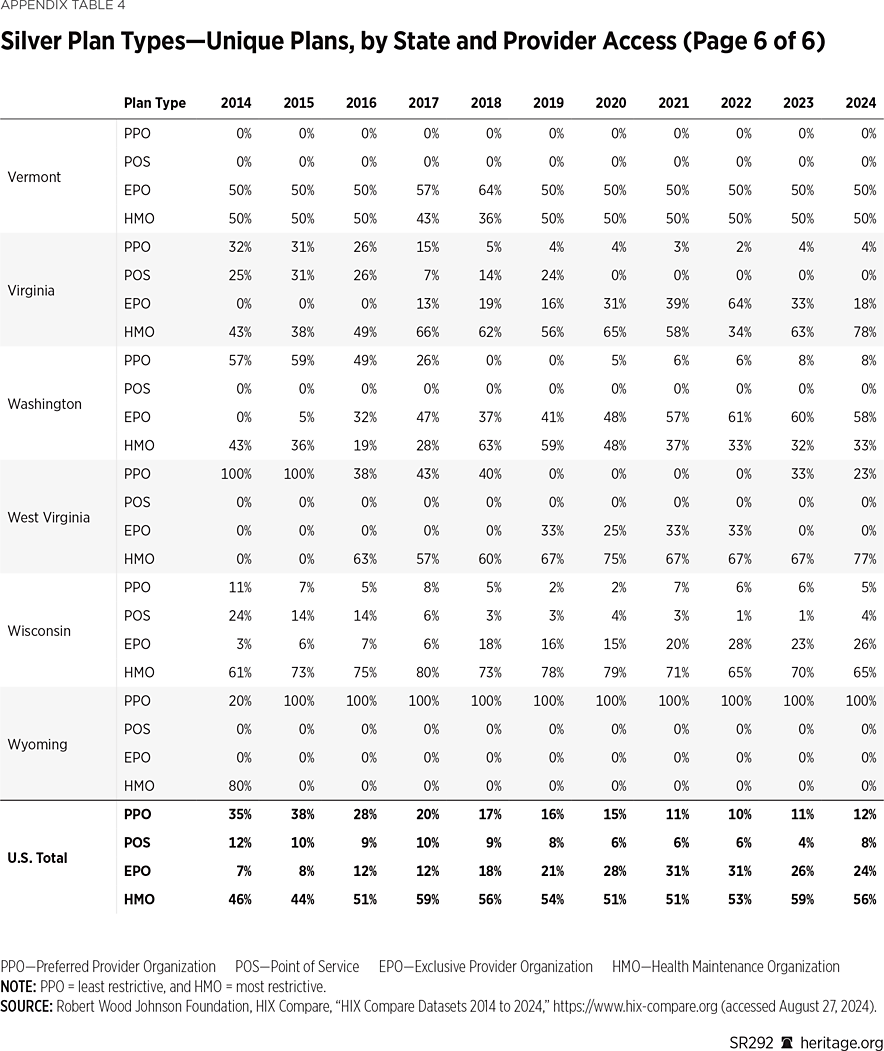
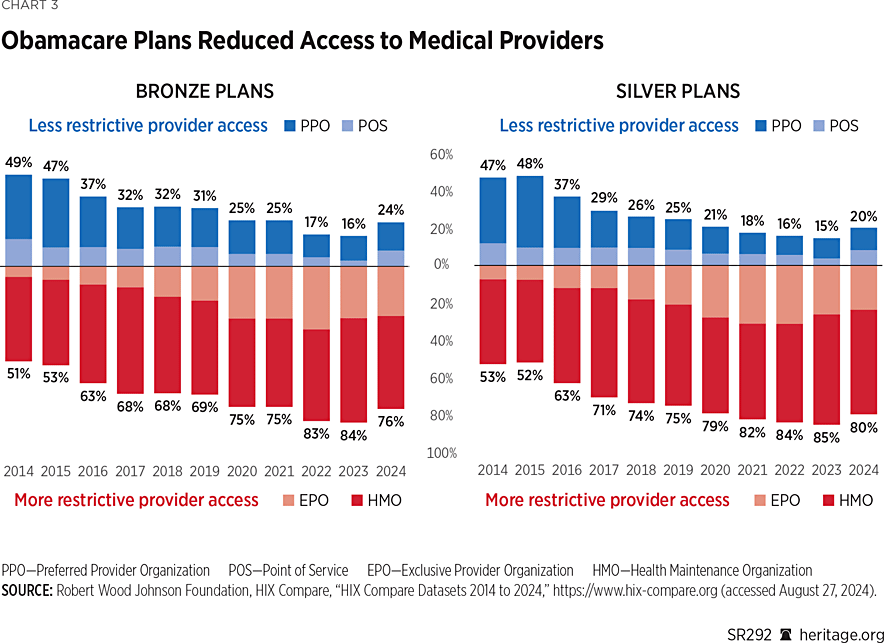
Another response by insurers to escalating claims costs for Obamacare coverage was to limit enrollee access to providers, either by reducing the number of “in-network” providers, providing no reimbursement for “non-network” providers, or requiring “pre-approval” for more covered services. Data on plan types offered in the exchanges shows how insurers have shifted to more “narrow network” plans.REF For the 2014 plan year, half (51 percent) of bronze plan designs had more restrictive provider networks. In 2024, that figure has increased to three-quarters (76 percent). Silver plans have experienced the same effect, shifting from 53 percent of plan designs having more restrictive networks in 2014 to four-fifths (80 percent) of plan designs in 2024.
Of the different plan types, the one that is least restrictive and offers the broadest network is the Preferred Provider Organization (PPO). It is also the most prevalent plan type in the employer-sponsored group insurance market, with about half of covered workers enrolled in PPO plans.REF By contrast, only 15 percent of bronze plan types and 12 percent of silver plan types offered on the Obamacare exchanges are PPO plans. Furthermore, 21 states have no PPO plans offered at the bronze level in the exchange, and 19 of those states also have no PPO plans offered at the silver level. (See Appendix Tables 3 and 4.)
Less Insurer Choice and Competition Under Obamacare
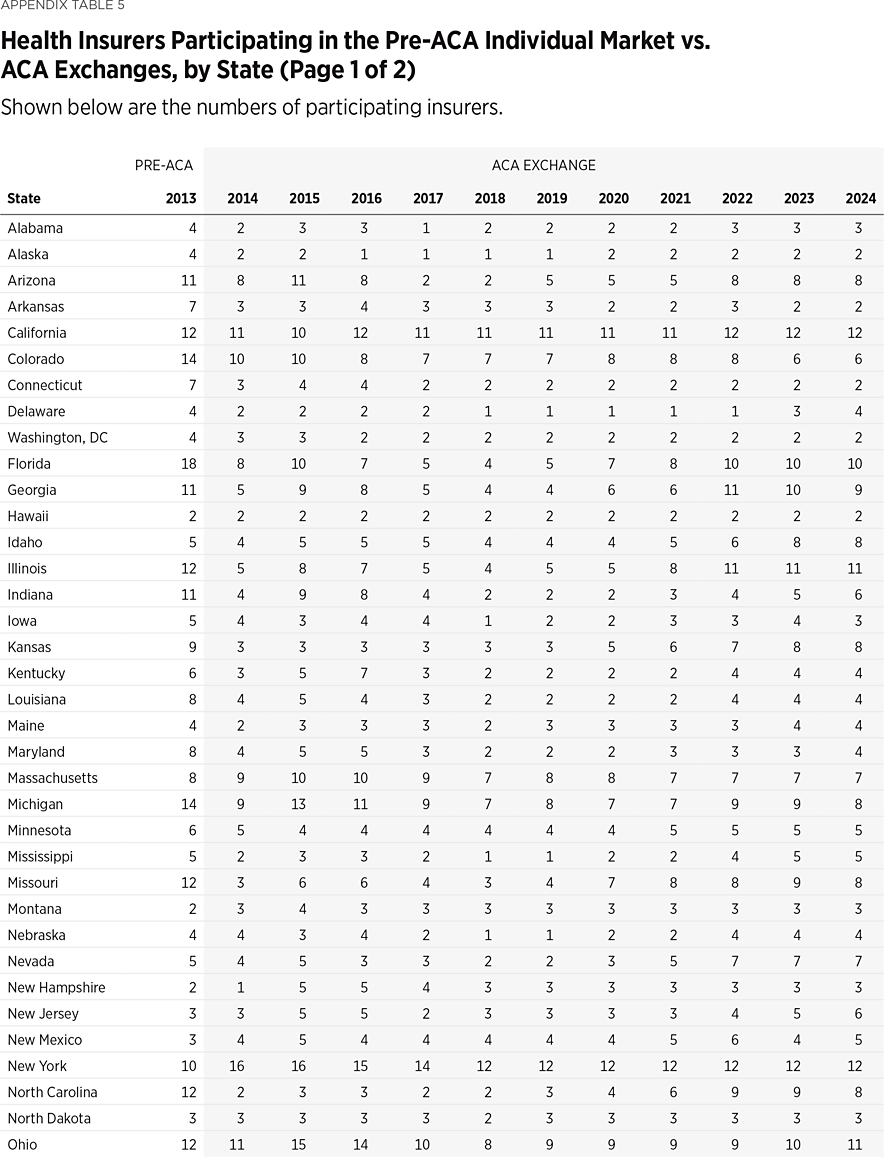
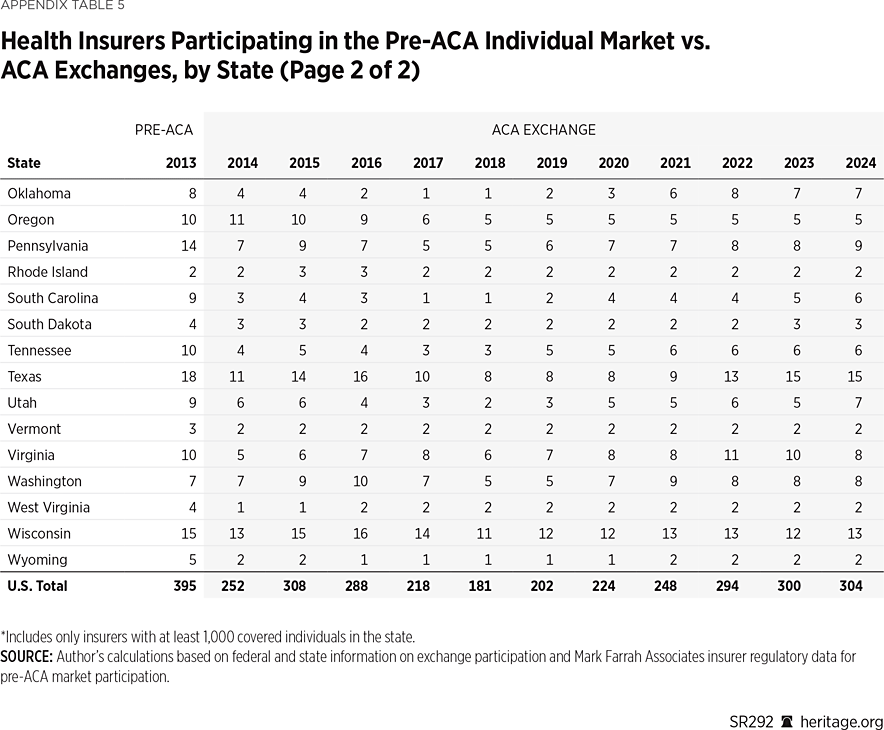
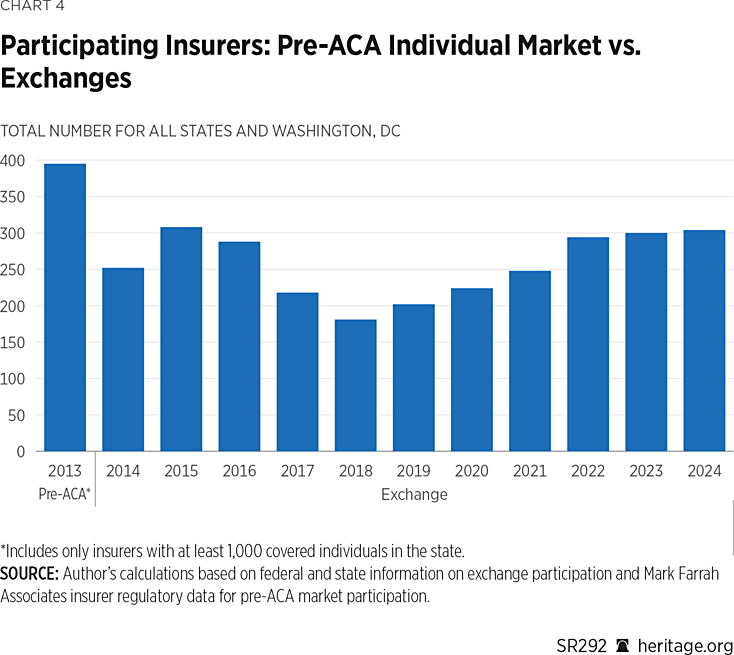
Although Obamacare’s proponents claimed that the law’s new regulations, subsidies, and exchanges would increase insurer competition, the actual results have been the opposite. In 2013, the year before Obamacare took effect, there were 395 insurers offering coverage in the individual market at the state level.REF By 2018 there were only 181 insurers offering coverage on the Obamacare exchanges, and there were eight states in which only one insurer offered exchange coverage.
The Trump Administration took steps to stabilize the Obamacare exchanges, with the result that insurer choice and competition increased in subsequent years. For 2024, there are 304 insurers offering exchange coverage at the state level. That is an increase of 123 insurers over the low of 181 in 2018, but it still leaves the 2024 exchanges 23 percent less competitive than the individual market was before the implementation of Obamacare. (See Appendix Table 5.)
However, despite increasing insurer participation over the past six years, only eight states have more insurers offering Obamacare exchange coverage in 2024 than they had before the ACA; eight others have the same number, and 34 states and the District of Columbia have fewer.
Greater Dependence on Government Programs Under Obamacare
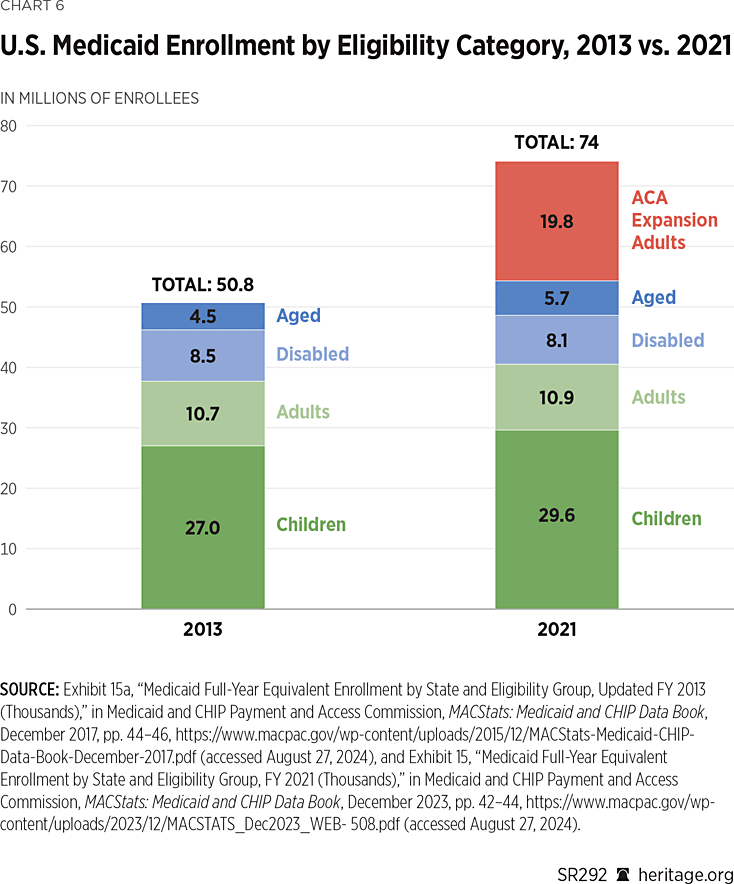
Obamacare also significantly expanded government-run coverage through Medicaid. Historically, Medicaid provided health care coverage to the vulnerable poor: children, pregnant women, the elderly, and people with disabilities. However, Obamacare expanded eligibility to able-bodied, non-elderly adults, most of whom do not have dependent children. Furthermore, Obamacare offers states a much higher level of federal financing (90 percent) for this new population than it offers for their existing Medicaid populations.
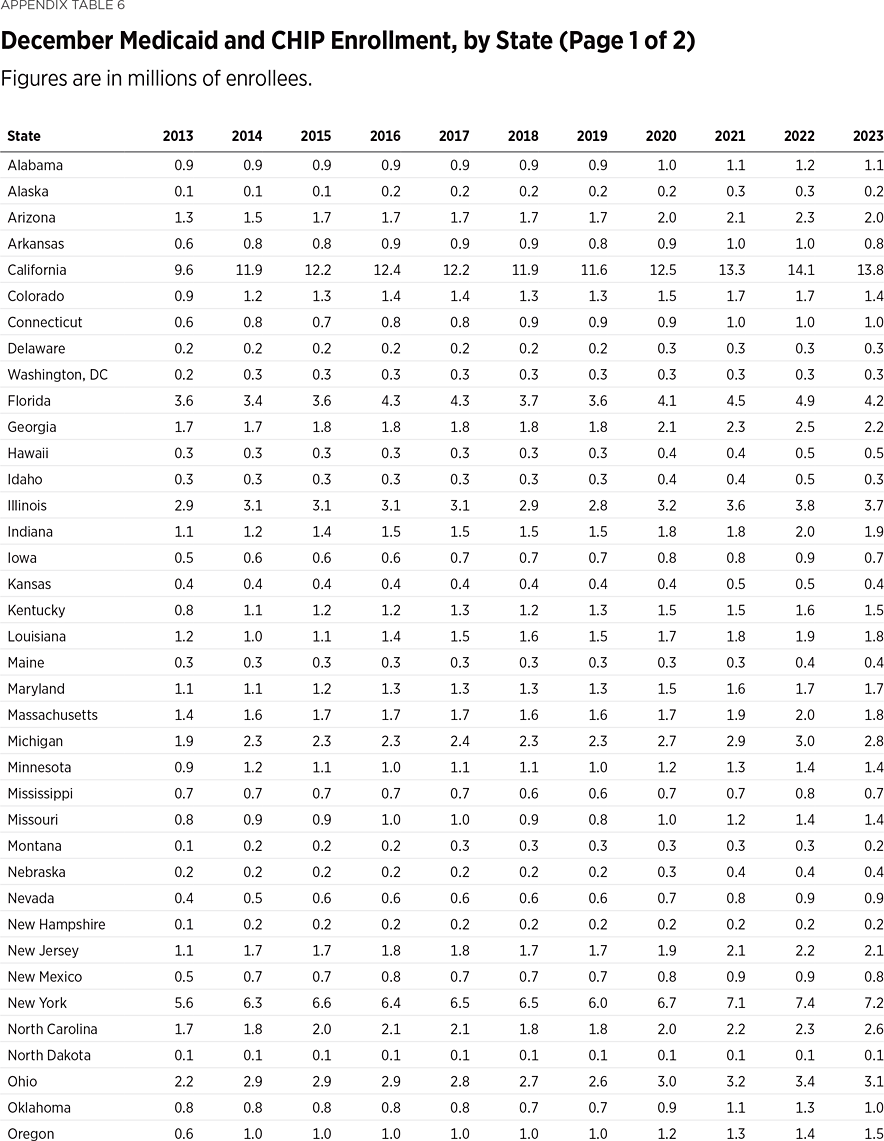
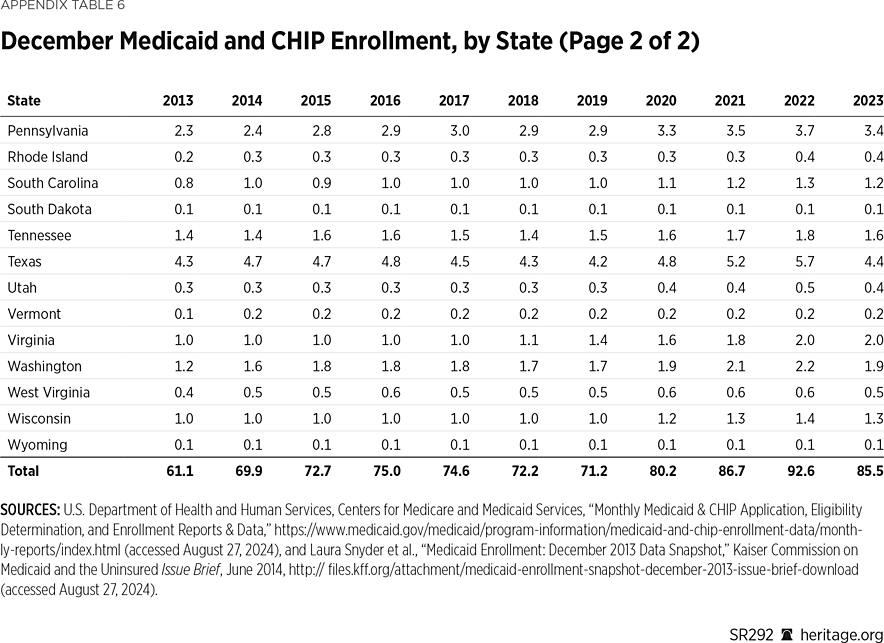
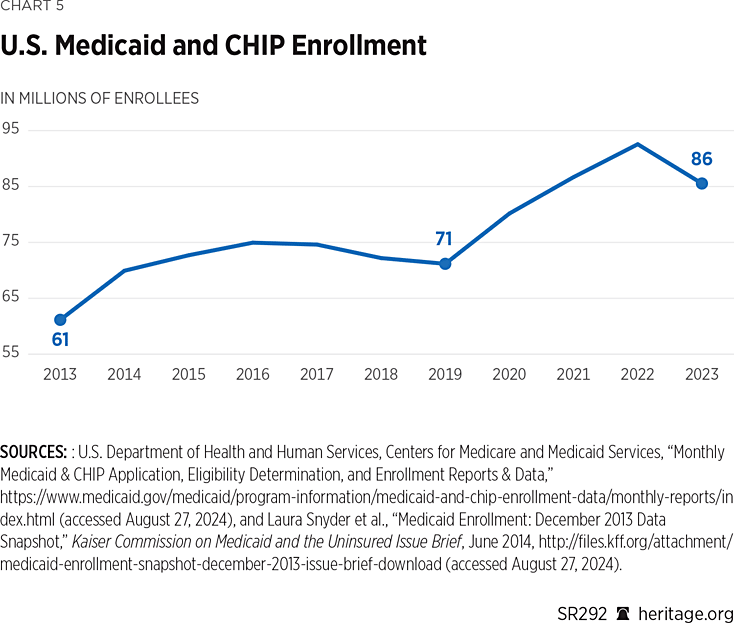
Between 2013—the last year before Obamacare took full effect—and 2023, enrollment in Medicaid and the Children’s Health Insurance Program (CHIP) increased by more than 24 million individuals, from 61.1 million to 85.4 million.REF In addition, during that 10-year period, enrollment more than doubled in four states: Alaska (+106 percent); Virginia (+106 percent); Oregon (+130 percent); and Nevada (+145 percent). (See Appendix Table 6.)
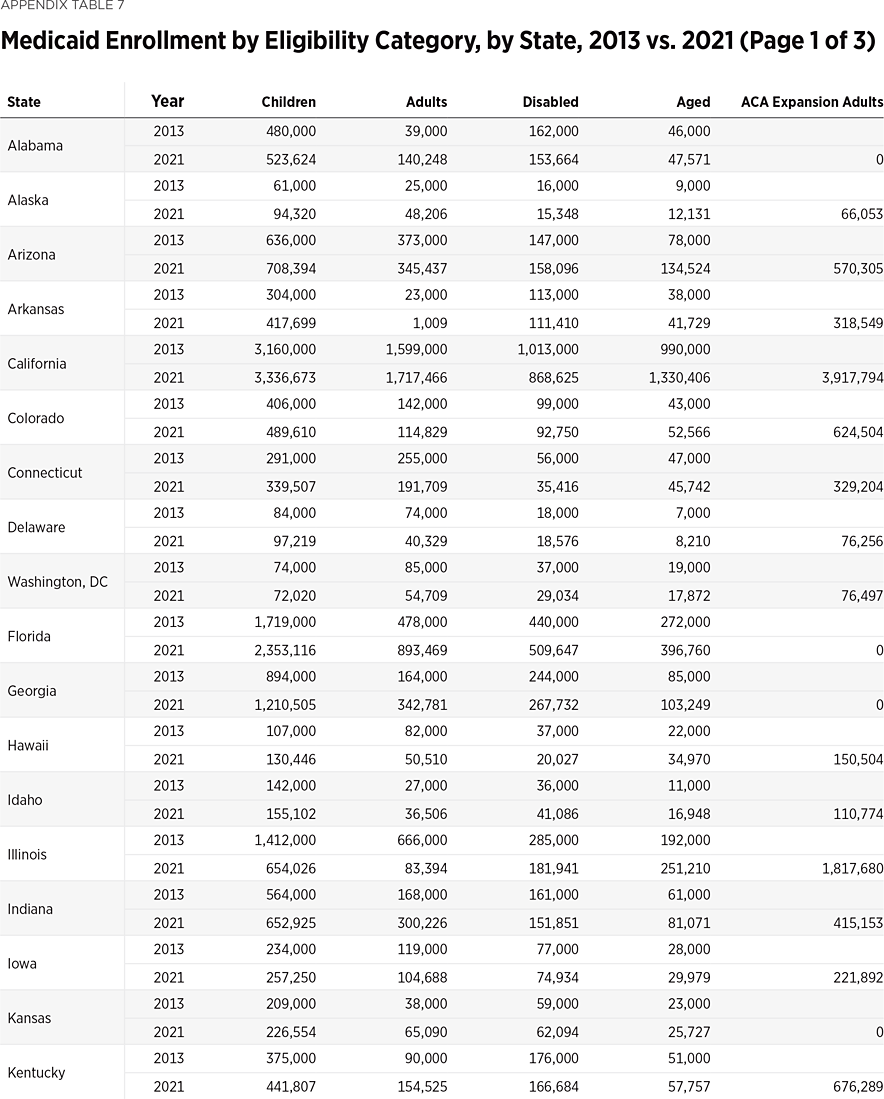
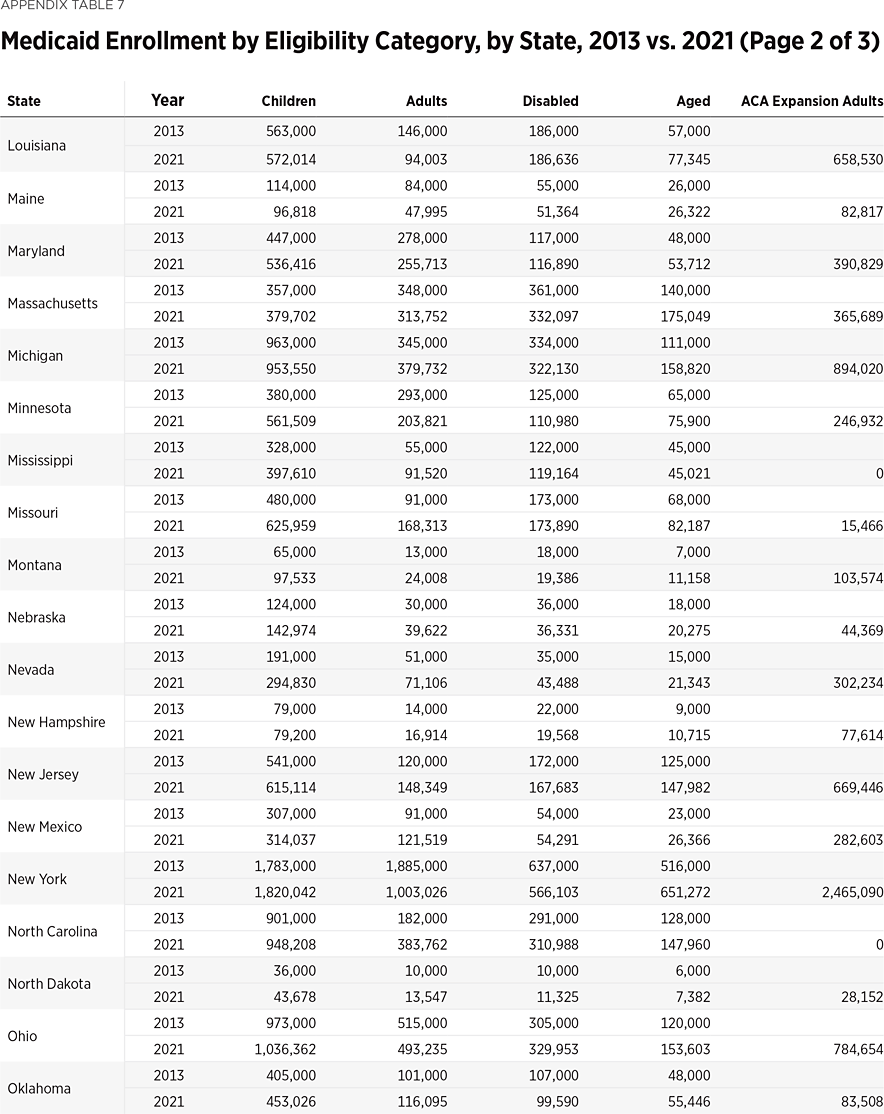
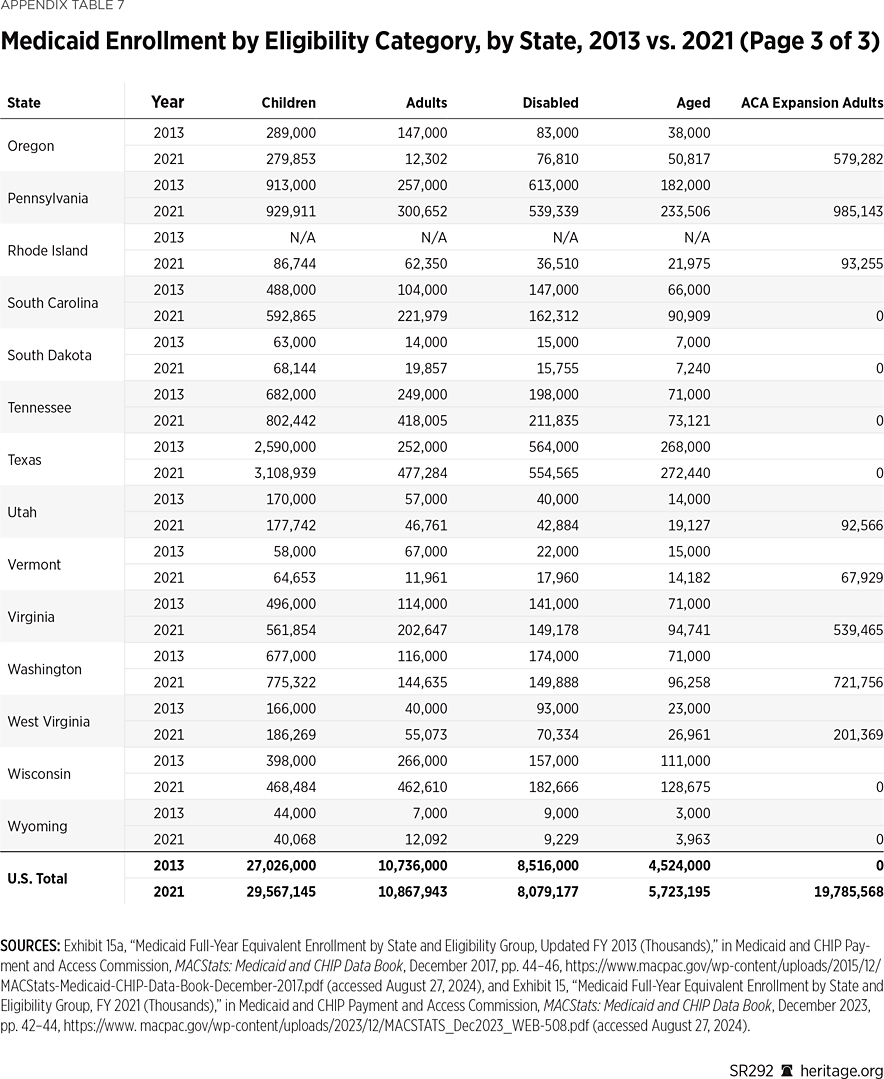
Furthermore, by providing states with much higher federal subsidies for new coverage of able-bodied adults, Obamacare effectively shifted Medicaid’s focus away from prioritizing the needs of the program’s existing and more vulnerable populations—low-income children, pregnant women, the elderly, and disabled individuals. That shift can be seen in the data for Medicaid enrollment by eligibility category. Between 2013 and 2021, almost 19.8 million newly eligible able-bodied adults were added to the program. In comparison, during the same period, Medicaid enrollment of children and the elderly increased by 2.5 million and 1.2 million, respectively, while the number of disabled enrollees declined by 400,000. (See Appendix Table 7.)
Higher Premiums for Medicare Drug Plans and Fewer Choices
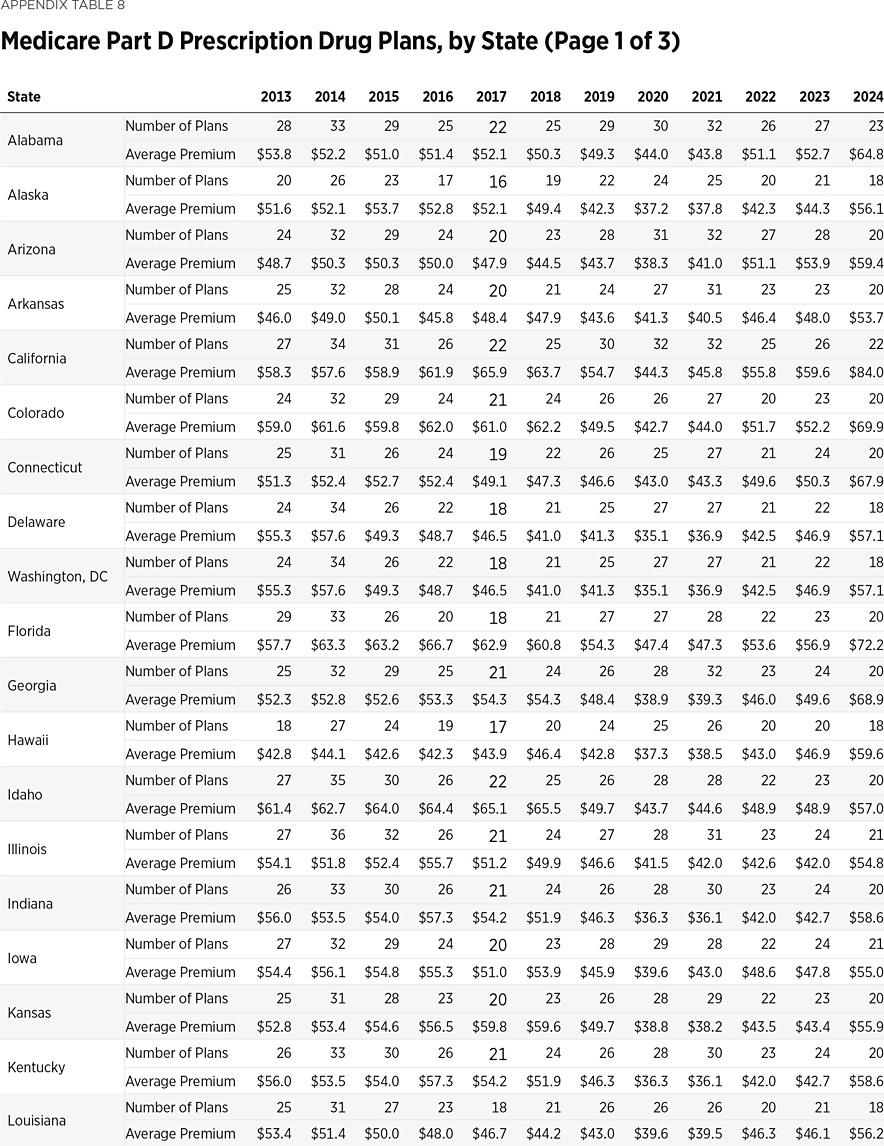
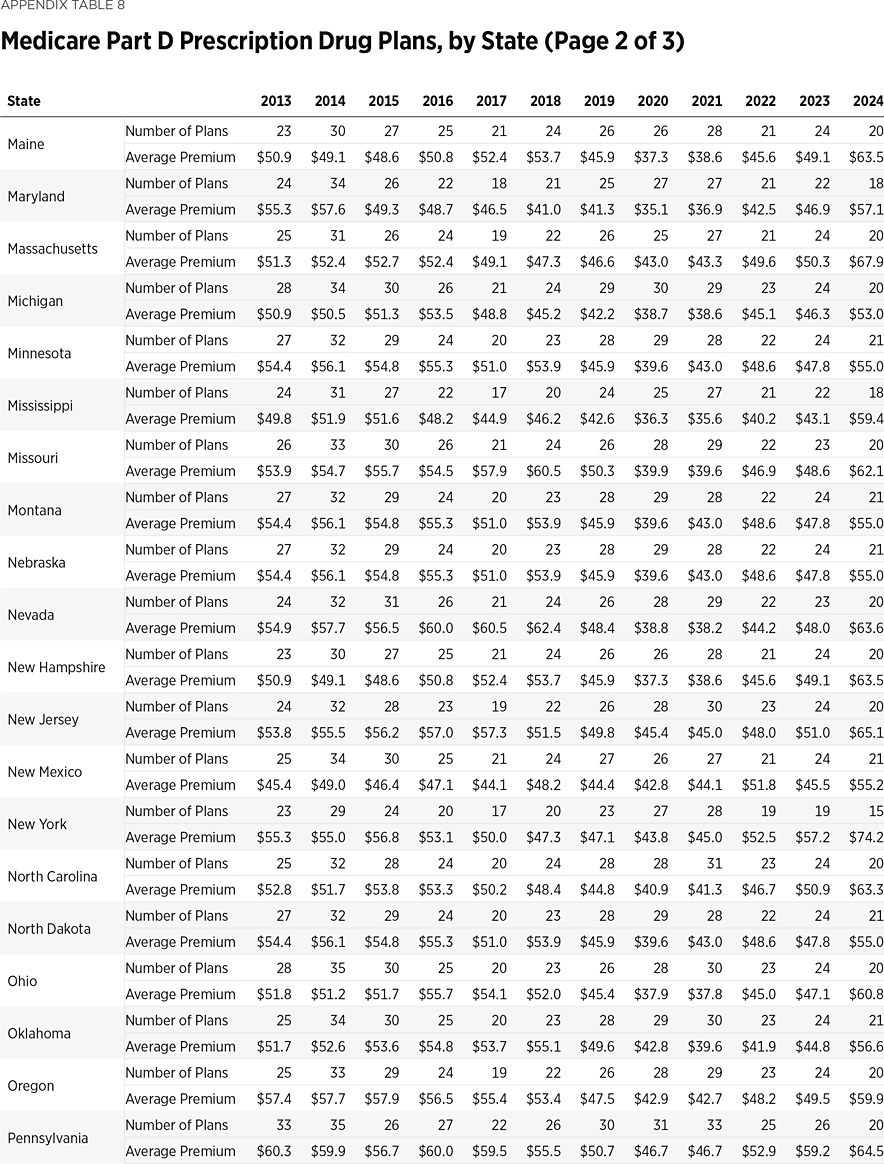
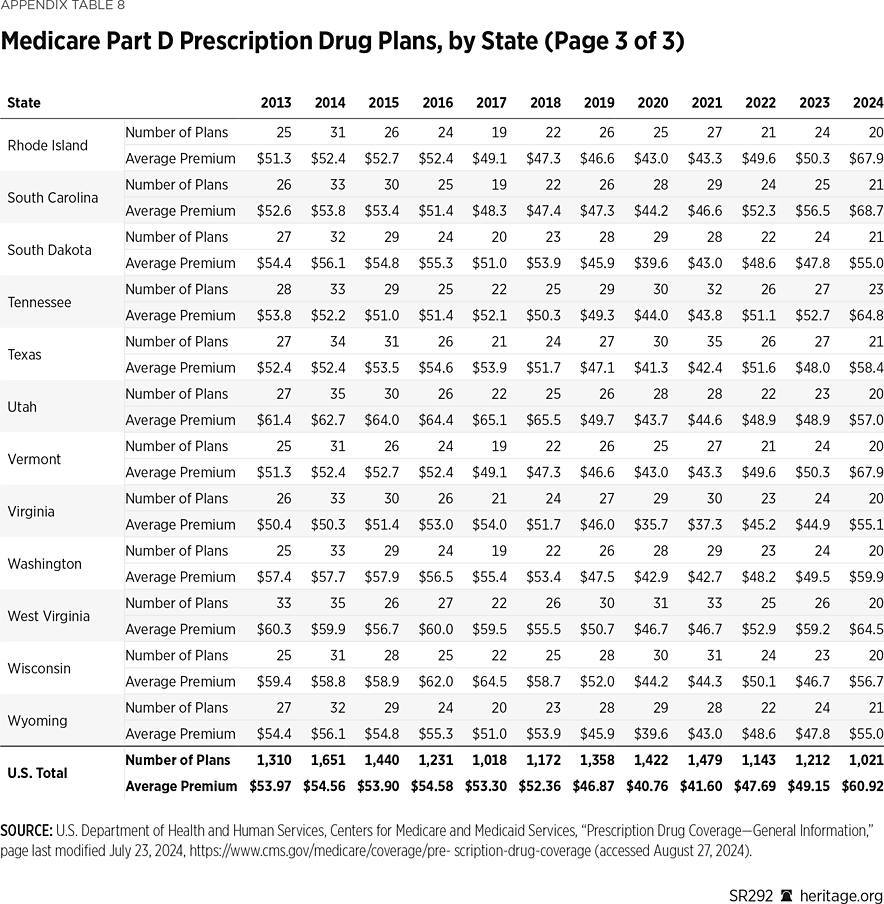
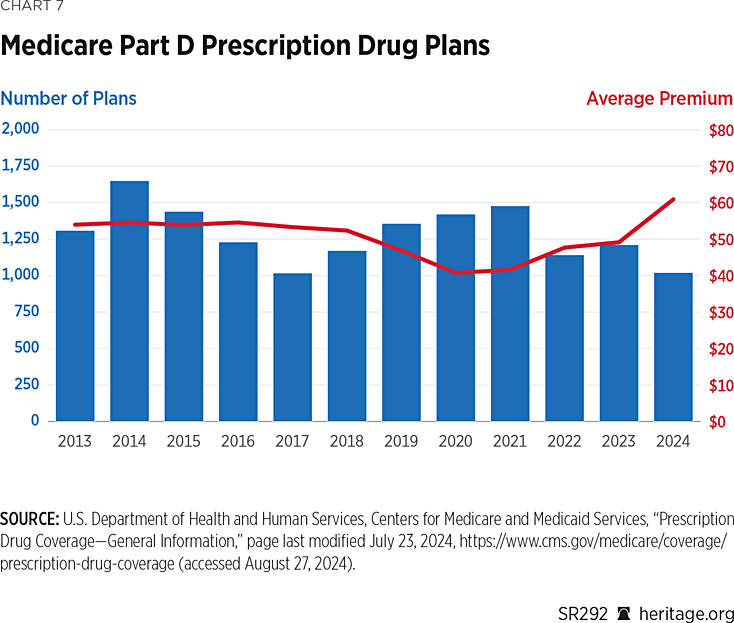
Included in the so-called Inflation Reduction Act of 2022 were a number of changes in the Medicare Part D prescription drug program.REF President Biden and congressional Democrats claimed those provisions would reduce the cost of prescription drugs for Medicare enrollees. So far, however, the result has been fewer Part D plans from which to choose coupled with much higher premiums. The data show that, relative to 2021, there are 31 percent fewer Part D plan choices available to enrollees in 2024, while the national average premium has increased by 46 percent, from $41.60 per month to $60.92 per month.REF In nine states, the average Medicare Part D plan premium has increased by more than 60 percent since 2021—including by 75 percent in Georgia and 84 percent in California.REF (See Appendix Table 8.) Furthermore, both of those adverse trends are expected to accelerate over the next several years as more provisions of the legislation take effect.REF
Conclusion
Across all major health care measures, health care is trending in the wrong direction. Premiums are up, choices are down, and access to providers is restricted.
Obamacare resulted in higher costs and fewer choices in the individual health insurance market and added millions of able-bodied adults to Medicaid. Now the so-called Inflation Reduction Act is beginning to take effect, and it is having similar effects on Medicare Part D prescription drug plans. The result will be increased premiums and fewer plan choices for seniors.
Without change, these trends are likely to continue into the foreseeable future, thereby undermining access to and the affordability of health care coverage for millions of Americans.
Edmund F. Haislmaier is the Preston A. Wells, Jr., Senior Research Fellow in the Center for Health and Welfare Policy at The Heritage Foundation.
