The Affordable Care Act (ACA), known as Obamacare, produced major dislocations in the individual (non-group) health insurance market by imposing a raft of new mandates and regulations, coupled with new income-related coverage subsidies. The results have been not only reduced insurer choice and competition, but also much higher health insurance premiums for millions of Americans.REF
Measuring the Cost of Health Insurance
Premiums charged for health insurance coverage vary due to differences among plans in their scope of covered benefits, their levels of patient cost sharing, and their panels of participating providers, as well as differences in enrollee demographics (such as age and location). Furthermore, customer purchasing decisions reflect personal preferences among the available options offering different combinations of price and benefit.
Thus, the best way to analyze changes in premiums is to use data on how much customers actually paid for coverage. That approach captures all the varied effects of plan designs and consumer purchasing decisions.
In addition, that approach also reflects any changes to the risk profile of the overall insurance pool (which is a key factor in insurer pricing calculations) that can result from a significant share of previous customers exiting the market, or a significant number of new customers entering the market. In the case of the individual health insurance market, both of those changes occurred in response to Obamacare’s simultaneous application of new regulations and new subsidies to that market.REF
Effects of the ACA on the Individual Market
Starting in 2014, the ACA imposed a number of costly new mandates and regulations on individual-market health insurance coverage and displaced private markets by creating new government-run health insurance “exchanges” to sell insurance. Partly to offset the increased costs of its mandates, the ACA also provided income-related subsidies for plans purchased through those exchanges.
The law’s new mandates and regulations (but not its subsidies) also applied to coverage purchased outside the exchanges, though it did allow insurers to renew older policies (without all the new requirements) for a period of time. However, the design and implementation of the law had the effect of reducing the availability of those so-called grandfathered plans in subsequent years, as insurers discontinued them—either voluntarily or in response to directives from state insurance regulators.
For this analysis, we used data from the annual Medical Loss Ratio (MLR) reports—which insurers are required to file with the Centers for Medicare and Medicaid Services (CMS)—to measure the effects of Obamacare on the cost of individual market coverage.REF
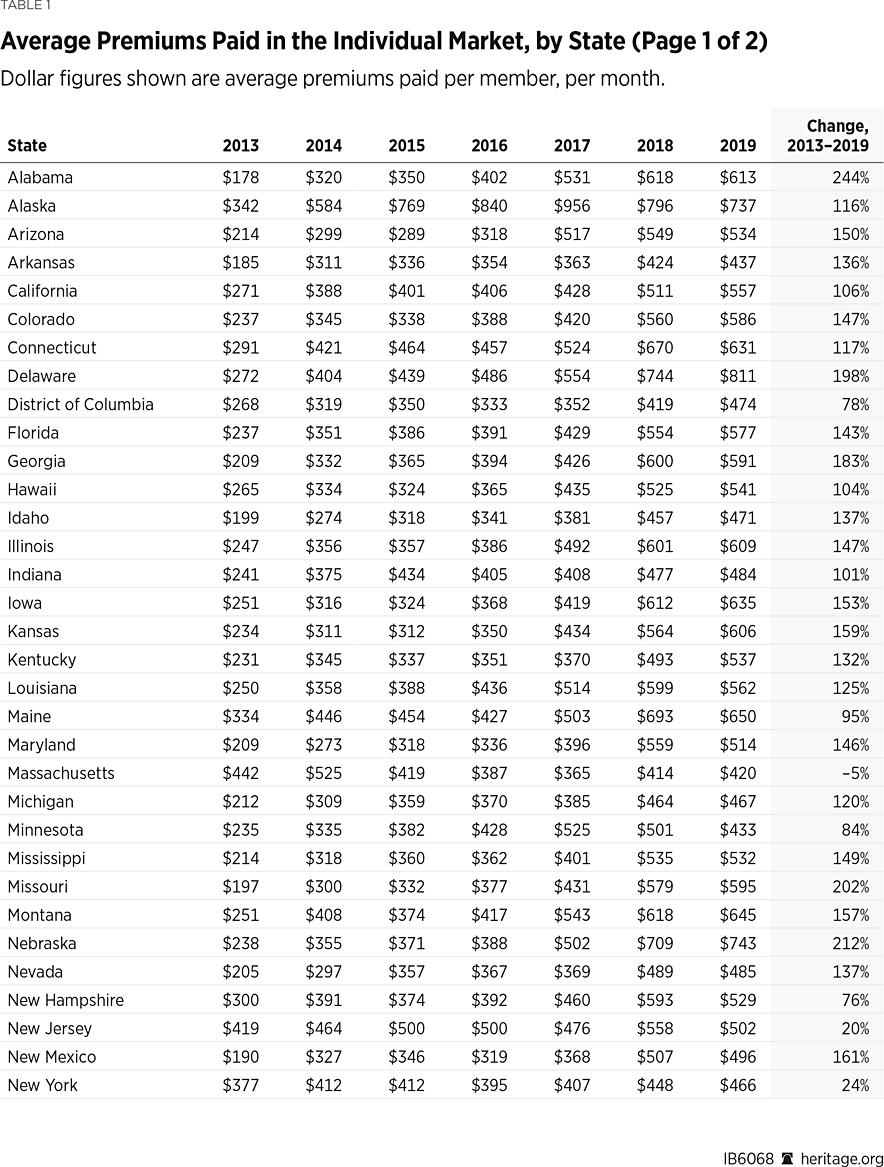
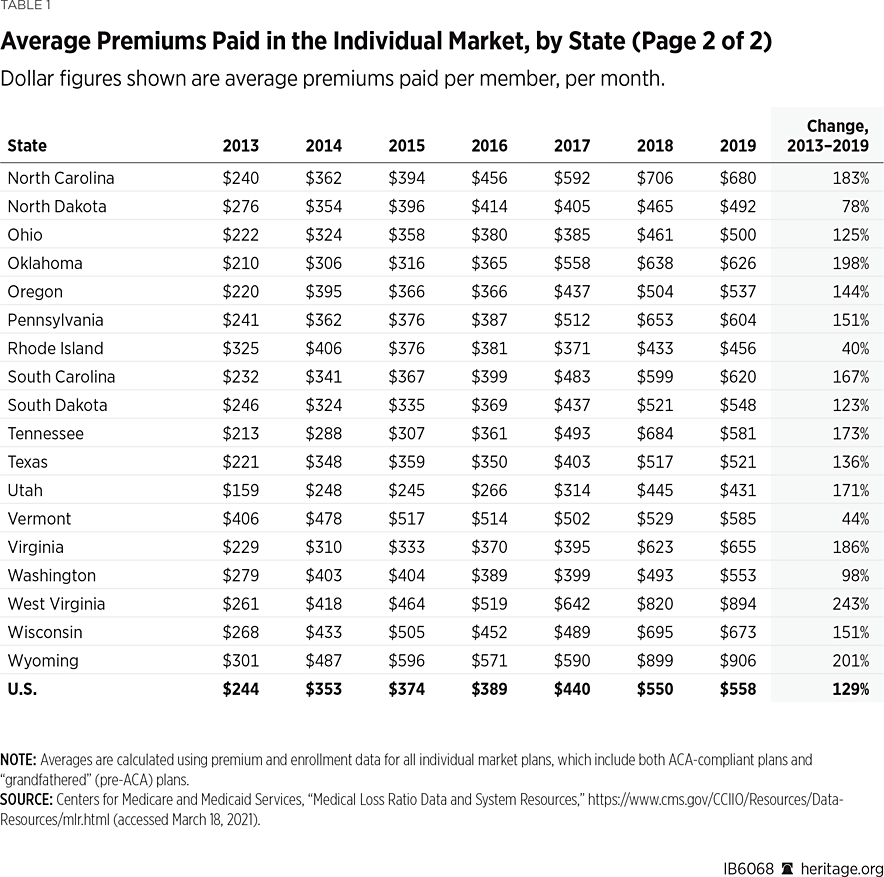
We calculated per-member per-month (PMPM) figures for the average cost of coverage at the state and national levels by dividing total premiums earned by the total number of member months. The resulting numbers, seen in Table 1, show the average monthly premiums that enrollees actually paid for coverage.
As 2013 was the last year of the pre-ACA market, we used that as the base year, followed by each subsequent year for which MLR reports are available (through 2019).REF
Obamacare Doubled the Cost of Individual Market Health Insurance
As Table 1 shows, the national average monthly premium paid in the individual market in 2013 was $244, while by 2019 it was $558—more than doubling (a 129 percent increase) from 2013 to 2019. In contrast, over the same period, the average monthly premium paid in the large-group employer market increased by only 29 percent—from $363 in 2013 to $468 in 2019. (For comparison purposes, we applied the same analysis to the MLR data for the large-group employer market).


The large-group employer market is not subject to most of Obamacare’s new insurance regulations. It is also more stable than the individual market, with less customer turnover and less change over time to the risk pool. By definition, any customer exits and entrances in that market involve groups of 50 or more enrollees, and the diversity of health status among the members of each group means that groups leaving or entering that market have little effect on the composition of the overall risk pool. Thus, changes over time in average monthly premiums paid for large-group employer insurance primarily reflect system-wide changes in the underlying cost of medical care (such as medical price inflation and the introduction of new therapies).
Consequently, if the 29 percent increase in the cost of large-group employer coverage over this period reflects the system-wide increase in the cost of medical care, then discounting the 129 percent increase in the post-ACA cost of individual market insurance by 29 percentage points indicates that Obamacare has basically doubled the cost of individual market insurance relative to what it would have been otherwise.
Wide Variations Among States
The changes in monthly premiums for individual coverage under Obamacare varied from state to state, as Table 1 shows.
In only one state, Massachusetts, was the average monthly premium paid in 2019 lower than it was in 2013. That is because almost all of the ACA’s new mandates and regulations, along with a similar set of income-related subsidies, were already in place in the Massachusetts individual market before the law took effect. In fact, as Table 1 shows, Massachusetts was the state with the highest average monthly premium pre-ACA ($422 in 2013).
Similarly, New Jersey, New York, and Vermont had also imposed costly regulations on their individual markets before the ACA; like Massachusetts, they all had high average premiums in 2013. Those states have experienced only modest increases in average premiums since the ACA’s implementation.
In contrast, states that had previously imposed fewer mandates and costly regulations on their markets have had much worse experiences under Obamacare. In 40 states, the average monthly premium for individual market coverage more than doubled by 2019—and it more than tripled in five of them (Alabama, Nebraska, Missouri, West Virginia, and Wyoming).
The Average Premium Declined in 20 States in 2019
Between 2018 and 2019, the average individual market premium in 20 states actually declined. In half of those states, the drop was quite small (between 0.6 percent and 3.7 percent), while the remaining 10 states saw reductions of between 5 percent and 15 percent.
Part of the explanation is that, faced with large losses from Obamacare coverage, many insurers sharply increased their rates in 2017 and 2018. Some of those insurers subsequently reduced their rates in 2019 once they determined that their earlier rate hikes had overshot the mark.
Effects of Section 1332 Waivers
More noteworthy are the declines in average premiums that occurred in all but one of the seven states that implemented “Section 1332 waivers” in 2018 and 2019. The waivers, authorized under Section 1332 of the ACA, gave those states regulatory relief from some of Obamacare’s mandates in order to enable them to better align federal subsidy dollars with enrollee need using state-based “reinsurance” programs that target funding to the sick with high health care costs.REF
The waivers granted to Alaska, Minnesota, and Oregon all took effect in 2018. Similar waivers for Maine, Maryland, New Jersey, and Wisconsin took effect in 2019.
As Table 1 shows, average premiums paid in Alaska declined by 23 percent (from $956 PMPM in 2017 to $737 PMPM in 2019), while average premiums paid in Minnesota declined by 18 percent (from $525 PMPM in 2017 to $433 PMPM in 2019). Oregon, which implemented a less aggressive reinsurance design under its waiver, did not experience a net decline in average premiums paid, but did see a somewhat slower rate of growth.
All four states that implemented their waiver programs in 2019 also experienced net declines that year in average premiums paid—with reductions of 3 percent in Wisconsin, 6 percent in Maine, 8 percent in Maryland, and 10 percent in New Jersey.
Five additional states implemented Section 1332 waiver programs in 2020, two more did so in 2021, and yet another has received approval to implement its program in 2022.REF If those programs have similar premium-reducing effects the results should be reflected in the MLR data for 2020 and subsequent years.
Conclusion
Data on how much Americans actually paid for their health insurance confirm that the ACA’s mandates and regulations dramatically increased the cost of individual market health insurance in almost all states.
The good news is that costs can fall if policymakers provide regulatory relief to allow states to redirect subsidies according to the unique needs of the citizens in their states. The initial data from states that implemented Section 1332 waiver programs show that permitting states to apply alternative approaches enabled them to reduce premiums, expand coverage options, and do a better job of focusing available resources on helping sick patients with high health care costs.
Because waiver programs are time-limited and temporary, the next step should be for Congress to build on the success by expanding the state flexibility granted during the past Administration, and making this flexibility permanent.REF
Edmund F. Haislmaier is Preston A. Wells, Jr. Senior Research Fellow in Domestic Policy Studies, of the Institute for Family, Community, and Opportunity, at The Heritage Foundation. Abigail Slagle is Research Assistant in Domestic Policy Studies.


