Large parts of northern Pennsylvania and southwestern New York lie above the Marcellus Shale, a vast subterranean expanse of rock estimated to contain up to 500 trillion cubic feet of natural gas.REF Pennsylvania has allowed companies to extract natural gas with the technique known as hydraulic fracturing—also called hydrofracturing and fracking.REF This method is combined with drilling in which the drill extends horizontally through the rock formation to expand the areas of access and allow more of it to be tapped.
Pennsylvania counties above the Marcellus Shale are bustling with this “unconventional drilling,” while neighboring New York declared a moratorium on hydraulic fracturing and horizontal drilling techniques in 2010.REF New York debated the use of these techniques until 2014, when Governor Andrew Cuomo’s (D) administration announced that it would ban hydraulic fracturing in New York State completely.REF
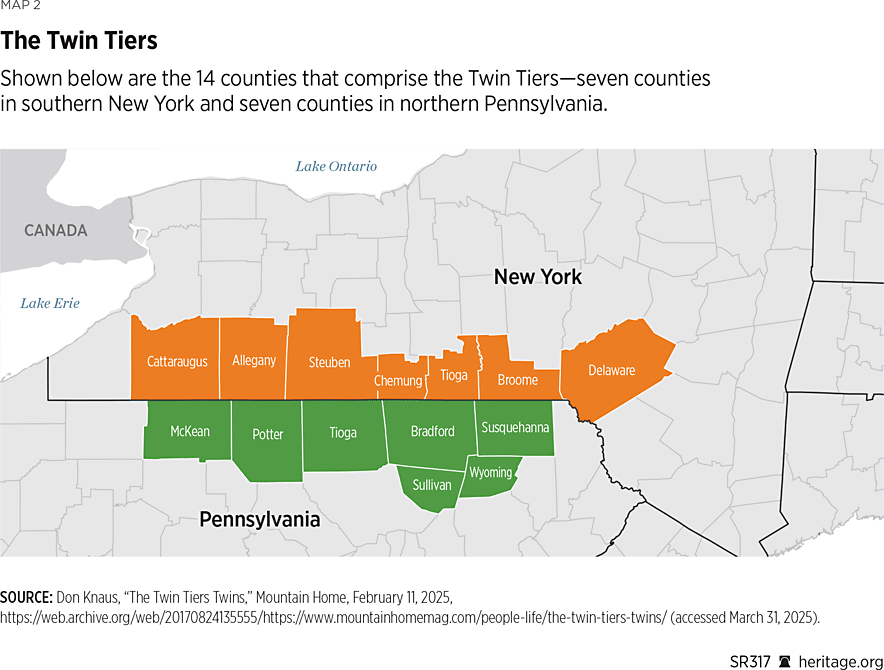
This scenario presents a natural experiment ideally suited for applying a difference-in-differences (DID) regression analysis to assess the effect of the hydraulic fracturing ban. This Special Report focuses on the Twin Tiers, a total of 14 counties rich in natural gas that lie on the border of southwestern New York and northern Pennsylvania. By focusing on the Twin Tiers one can compare the same natural gas resources in the two states. New York’s 2010 hydraulic fracturing ban is the onset of the treatment, with the seven New York counties designated as the treatment group. In contrast, the seven Pennsylvania counties, unaffected by the ban, serve as the control group.
The geographical proximity and economic similarities between these two sets of counties provide a robust basis for estimating the income and job losses in New York attributable to the ban. The authors’ findings indicate that approximately $11,000 per capita—$27,000 per family—could have been created in New York in the absence of the ban.
Background
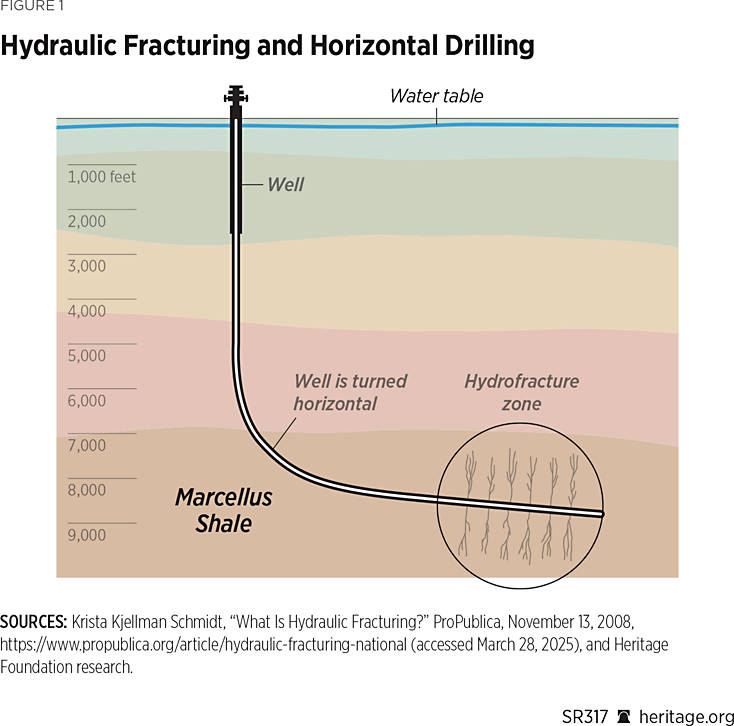
The shale revolution started in the late 1990sREF when energy companies employed a new method of extracting oil and natural gas that is trapped within the tiny pore spaces of shale rock. The combination of hydraulic fracturing and horizontal drilling enabled the United States to increase its production of oil and natural gas significantly.REF Hydraulic fracturing is performed by sealing off a portion of the drilling well and pumping in water. This produces pressure which fractures the surrounding rock, producing a reservoir with extensive fractures, intersected by a lengthy section of the wellbore. Horizontal drilling is a technique where a vertical well is turned 90 degrees and penetrates a long distance of reservoir rock.
Figure 1 demonstrates this combined process. The fusion of hydraulic fracturing and horizontal drilling techniques has revolutionized the energy sector, unlocking the potential to tap into oil and gas reserves in regions once deemed unreachable.
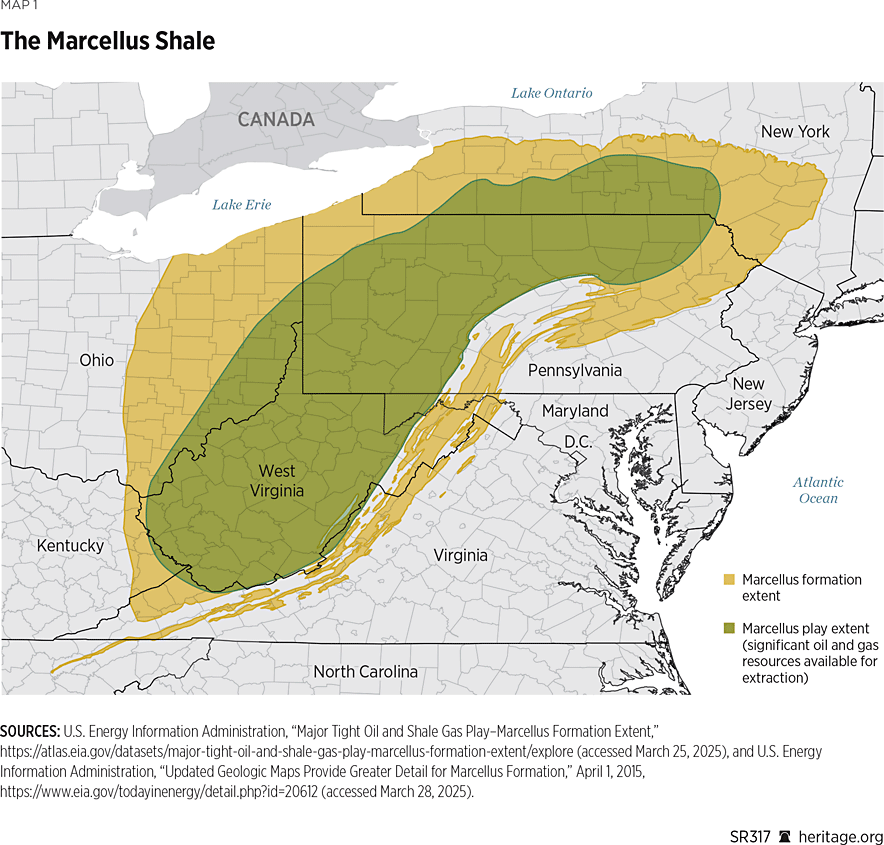
One of these formerly untapped reserves is the Marcellus Shale. Named after the town of Marcellus, New York, the Marcellus Shale extends throughout the northern Appalachian Basin, including southern New York, northern Pennsylvania, eastern Ohio, and western West Virginia.REF
Few geologists were initially optimistic about the possibility of extracting large amounts of natural gas from the Marcellus Shale.REF While some energy companies tried to extract gas from the Marcellus Shale before 2003, these initiatives resulted in little success. It was not until 2003 when Range Resources Corporation combined hydraulic fracturing and horizontal drilling that a substantial output of natural gas became available. This combination transformed the Marcellus Shale from a rock formation with little potential of producing natural gas into a “super-giant” with up to 500 trillion cubic feet of natural gas.REF
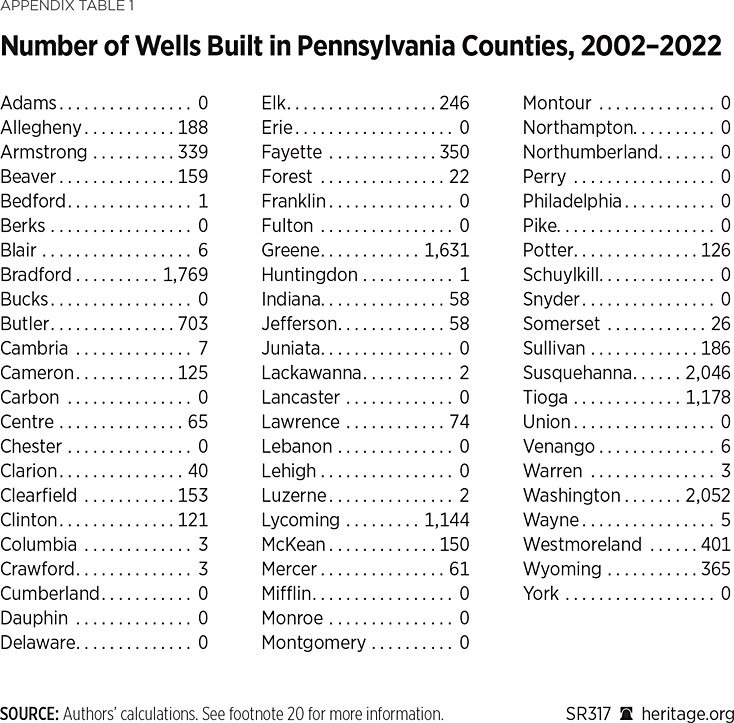
The use of this new technology created economic opportunities for counties located on the Marcellus Shale. The State of Pennsylvania realized the region’s economic potential from the beginning and started large-scale drilling operations. Since 2003, 13,701 wells have been built in Pennsylvania. The location by county of these wells is shown in Appendix Table 1. The drilling operations resulted in economic growth in Pennsylvania counties located above the Marcellus Shale, with income growth for residents and additional job creation.
The varied policy responses to hydraulic fracturing between neighboring states with the same shale, as occurred in Pennsylvania and New York, present a natural experiment. New York’s ban, based on environmental and public health concerns, has foreclosed immense economic opportunities.REF
Northeastern and southwestern Pennsylvania benefit from some of the thickest sections of the Marcellus Shale,REF yielding high returns on investment. Thicker shale with abundant organic matter ensures more shale-gas resource and fracturing conditions.REF The region is predominantly rural and contains many small towns. In contrast, central Pennsylvania has thinner shale, less-developed infrastructure, and a smaller labor pool, meaning that companies face higher operational costs for less potential gain than in more densely drilled regions in the state.
Like northeastern Pennsylvania, the southern New York counties also have access to the thickest sections of the Marcellus Shale. Therefore, these counties could benefit the most if the hydraulic fracturing ban was lifted. It is for this reason that this Special Report focuses on this very specific region, rather than on both states as a whole.
Literature Review
A substantial body of academic research underscores the economic benefits derived from the development of the Marcellus Shale through hydraulic fracturing and horizontal drilling.
James Feyrer, Erin Mansur, and Bruce SacerdoteREF explored the broader economic effects of the hydrofracturing revolution. Their study finds that new oil and gas production not only benefits the immediate area but also stimulates wage and business income growth up to 100 miles away from production sites. Their research indicates a durable effect on local economies, with significant portions of the wage increases persisting for at least two years, contributing to overall U.S. employment growth and income per capita enhancements.
Alexander Bartik and his colleaguesREF explore the effects of hydraulic fracturing on local economies and a wide set of economic indicators. Using a Rosen-Roback-style spatial equilibrium model, the researchers calculate the estimated willingness-to-pay (WTP) for allowing fracking. They conclude that hydraulic fracturing leads to improvements in a wide set of economic indicators, such as job creation and higher local incomes. They also conclude that additional jobs are created in the natural resources and mining sector and in other sectors that indirectly benefit from shale gas development.
Other studies highlight the significant effect of shale gas development on job growth, including non-energy-related employment. Thiemo FetzerREF investigates the effects of hydraulic fracturing on employment across the entire United States. Using the share of mining sector employment, along with a post-2008 variable interacting with the proportion of a county’s surface containing shale resources as an instrument, Fetzer employs a method similar to the one in this Special Report by designating pre-treatment and post-treatment periods, with 2008 as the cutoff date. The findings reveal that the shale revolution generated between 500,000 and 600,000 new U.S. jobs without causing a contraction in the tradable goods sector, despite rising labor costs. Additionally, Fetzer estimates that each job in the oil and gas sector creates approximately 2.17 additional jobs in the local economy.
The above studies focus on the effects of hydraulic fracturing on the entire U.S. economy. Other research specifically focuses on the Marcellus Shale. Studies by Timothy Considine and Robert WatsonREF have measured the significant role of the shale gas drilling industry in job creation and economic growth within Pennsylvania. In 2009, they estimated that more than 44,000 jobs were created in the state since 2003, alongside a $3.87 billion boost to the economy, reflecting both direct employment in the industry and indirect benefit from equipment purchases and land royalties.
A 2013 study by Diana Furchtgott-Roth (one of the authors of this Special Report) and Andrew Gray examined fracking in Marcellus Shale counties in New York and Pennsylvania between 2002 and 2011.REF Looking at income gains between 2007 and 2011, they found that Pennsylvania counties with hydrofractured gas wells performed better across economic indicators than those that had no wells. The more wells a county contained, the better it performed. Between 2007 and 2011, per capita income rose by 19 percent in Pennsylvania counties with more than 200 wells, by 14 percent in counties with between 20 wells and 200 wells, and by 12 percent in counties with fewer than 20 wells. In counties without any hydrofractured wells, income went up by only 8 percent. Using the Pennsylvania data to project hydrofracking’s effect on New York counties, the Furchtgott-Roth and Gray study found that the income of residents in the New York counties above the Marcellus Shale would have seen income growth rates of up to 15 percent for a given four-year period if the state’s moratorium were lifted.
Rather than directly estimating job growth attributable to hydraulic fracturing, this Special Report adds to the existing literature in two ways. First, it focuses on quantifying the negative effect of fracking bans in terms of gross domestic product (GDP) per capita. Second, it focuses on a select, economically similar, region of the Marcellus Shale in the two states rather than focusing on the entire country, entire states, or entire Marcellus Shale. Beyond contributing to the literature, the analysis here provides policymakers with updated insights into the economic divergence between Pennsylvania and New York, helping them to better understand the long-term consequences of fracking bans on regional economic performance.
Data
The number of horizontal, hydraulically fractured wells drilled in each of the seven Pennsylvania Twin Tier counties from 2002 to 2022 is available from the Pennsylvania Department of Environmental Protection website.REF The “unconventional” category encompasses the relevant sets of hydraulically fractured wells. The number of such wells was low until 2007, when unconventional well-drilling began in earnest in Pennsylvania.
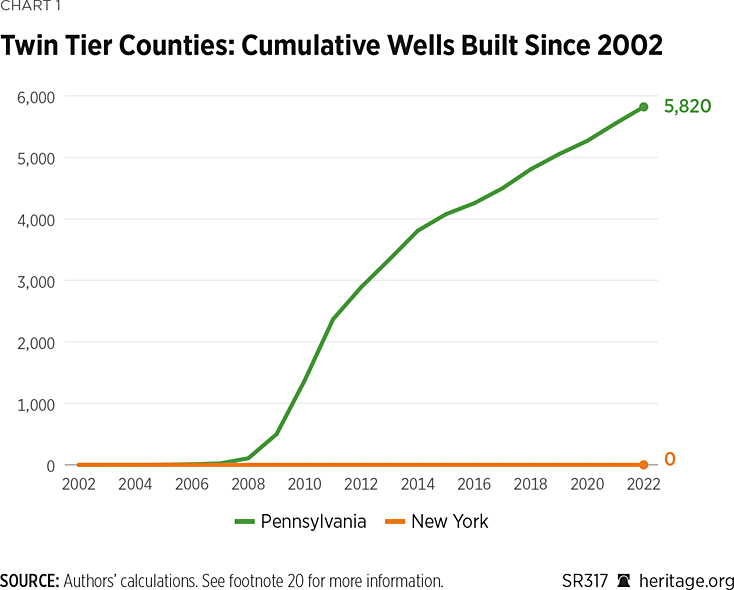
Chart 1 displays the total cumulative number of wells built in the northern Pennsylvania Twin Tier counties between 2002 and 2022. The line is steepest around its beginning stages, peaking around the year 2011. After the initial heavy drilling, the rate of new wells being built slowed down, as a hydrofracturing well lasts an average of 20 years to 40 years.REF
The authors of this Special Report collected and analyzed data using a variety of by-county metrics, including population, income, crime, employment, and industry-specific GDPREF on an annual basis. All economic variables were retrieved from the Bureau of Economic Analysis at the U.S. Department of Commerce, while the employment data came from the Bureau of Labor Statistics at the U.S. Department of Labor.REF County-level economic data are available through 2022. All periodic economic assessments were made between 2002 and 2022. The authors also collected local employment data for both New York and Pennsylvania from the Pennsylvania and New York Departments of Labor,REF allowing them to create the variable Total Enterprises, which captures the growth in establishments including restaurants, barber shops, locally owned businesses, and the self-employed.
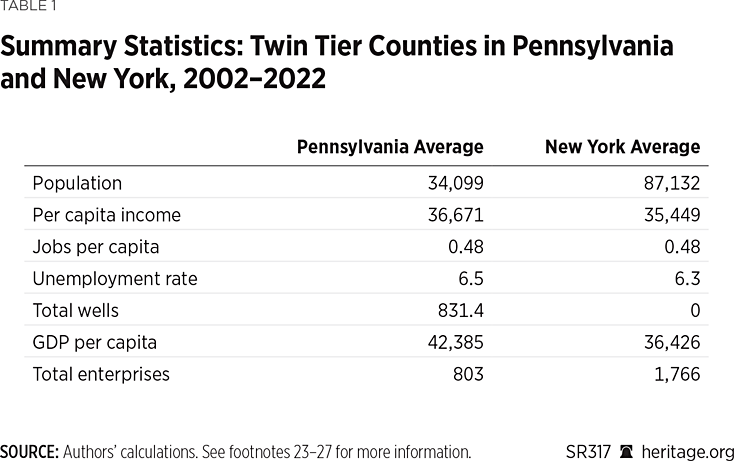
Table 1 shows the summary statistics for the Twin Tiers in northern Pennsylvania and southern New York. The New York counties that are part of the Twin Tiers are Allegany, Broome, Cattaraugus, Chemung, Delaware, Steuben, and Tioga. The Pennsylvania counties are Bradford, McKean, Potter, Sullivan, Susquehanna, Tioga, and Wyoming.REF
The panel data yield observations of seven counties in each state spanning from 2002 to 2022. Across this series, New York and Pennsylvania each have 147 observations, with 294 in total. Because of the hydraulic fracturing ban in New York, the number of wells built in New York is zero. As Table 1 shows, there are a number of similarities between the Pennsylvania and New York counties. Notably, the jobs per capita average and the unemployment rate are very similar. Although aggregate populations differ, these disparities do not have any meaningful effect on the results, since much of the focus of this analysis is on per capita statistics. However, at the end of the period, Pennsylvania is ahead of New York, as seen in Chart 2.
The variable of most interest is GDP per capita, which is a more comprehensive measure of well-being than the number of jobs. While job growth captures only the number of positions created, it does not account for the quality of those jobs, income levels, productivity, or overall economic output. GDP per capita, on the other hand, reflects the total economic activity per person, incorporating both employment and income effects, as well as broader productivity trends. This metric allows assessment not just of whether fracking bans influence employment, but also how they shape overall prosperity and living standards in the region. As shown in Chart 2, since 2009 the Pennsylvania Twin Tier counties have had higher GDP per capita than their New York counterparts.
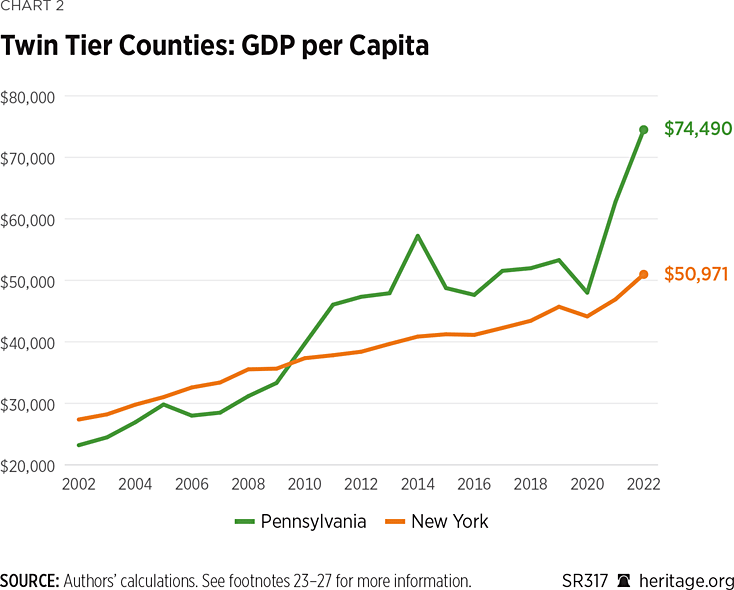
Chart 2 tracks the average GDP per capita for the Twin Tier counties in Pennsylvania and New York between 2002 and 2022. The data reveal a clear reversal in economic performance over time. Before 2009 and the growth of the shale revolution, New York counties consistently reported higher GDP per capita, reflecting their historical economic strength. However, with the advent of hydraulic fracturing in Pennsylvania around 2007, the trend shifted, and Pennsylvania counties experienced a significant uptick in GDP per capita. This was driven by energy-sector growth and its spillover effects on other industries, including construction, retail, and hospitality. In contrast, New York counties, restricted by the 2010 ban on hydraulic fracturing, did not benefit from the shale boom, and their economic trajectory remained relatively stagnant. In 2009, the Pennsylvania Twin Tier counties overtook their New York counterparts.
This divergence underscores the importance of policy in shaping regional economic outcomes. Pennsylvania’s embrace of hydraulic fracturing transformed its Twin Tier counties into economic hubs, whereas New York counties forfeited their own potential growth.
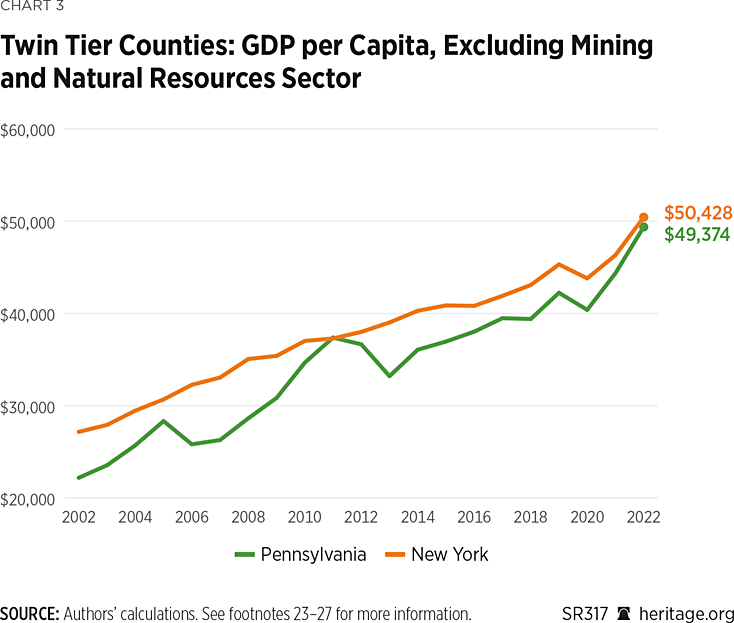
Chart 3 presents per capita GDP trends for the Twin Tiers region of New York and Pennsylvania, excluding the mining and natural resource sector. This exclusion helps to isolate the broader economic effect and assess whether growth was driven by industries beyond resource extraction. Chart 3 shows that, even without mining, Pennsylvania’s Twin Tiers experienced significant GDP growth, while New York counties maintained a higher but steadier trajectory. This pattern strongly suggests that the economic boom in Pennsylvania was largely driven by hydraulic fracturing. The exclusion of mining isolates the effect of other economic sectors, removing the influence of resource extraction from the analysis. However, even with the exclusion of sectoral natural resource GDP, a steep growth in Pennsylvania Twin Tier counties remains. This steep GDP growth is because local businesses, such as hotels, motels, restaurants, and laundromats, also benefit from increased oil and gas production. More fundamentally, with greater access to affordable and reliable energy, hiring costs decline and economies have greater prospects of growth.
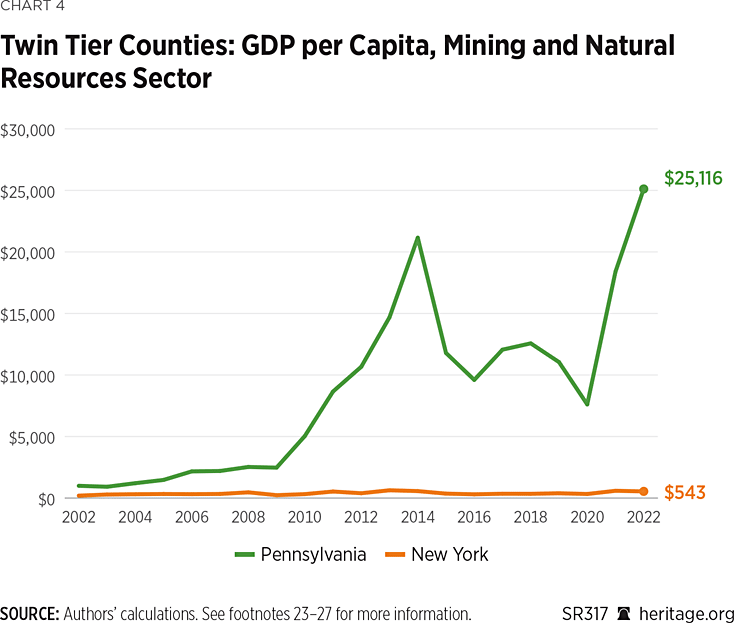
Chart 4 shows GDP per capita in the mining and natural resource center in the Twin Tiers counties of New York and Pennsylvania. In mining and natural resources, Pennsylvania counties rapidly move ahead of New York counties. GDP per capita in mining and resources starts at close to 0 in both states in 2002. It gradually increases in Pennsylvania counties, rising to $25,000 per capita in 2022, while remaining close to 0 in New York counties.
That Pennsylvania only surpasses New York counties in GDP per capita when mining is included underscores how crucial hydraulic fracturing has been to Pennsylvania’s economic growth. It directly ties the increase in GDP to the shale revolution, as these sectors are at the core of fracking activities. Without the economic surge from these industries, Pennsylvania’s economy in the Twin Tiers would have remained below New York’s in terms of GDP per capita, highlighting the transformative role that fracking played in reshaping the economic landscape of Pennsylvania’s Twin Tier counties. These results serve as compelling evidence that hydraulic fracturing was the primary driver of Pennsylvania’s relative economic success during this period.
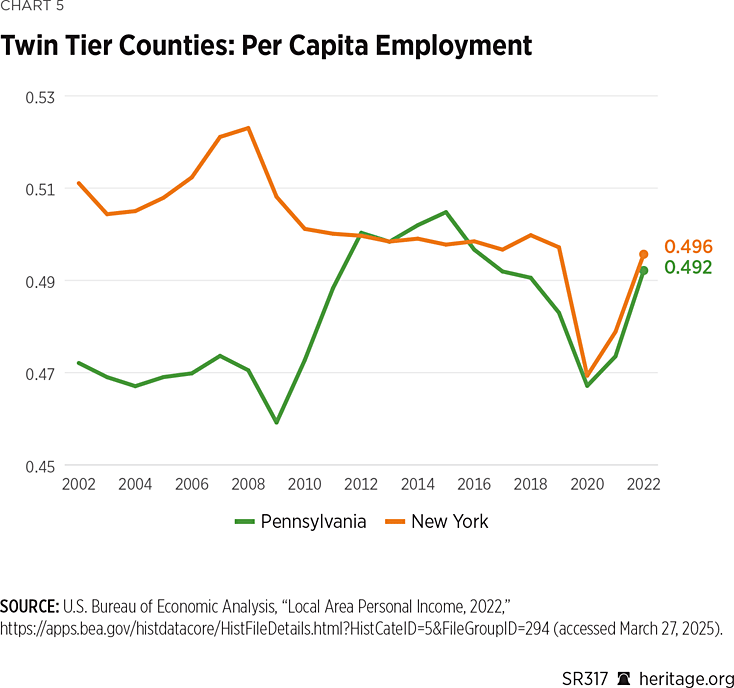
Chart 5 illustrates total employment per capita in the Twin Tier counties of Pennsylvania and New York from 2002 to 2022. Employment per capita is a measure of workforce participation relative to the total population, reflecting the overall strength of local labor markets. Prior to the shale revolution, New York’s Twin Tier counties consistently had higher employment rates than their Pennsylvania counterparts. After the expansion of hydraulic fracturing in Pennsylvania and New York’s fracking ban in 2010, a notable shift occurred. Employment in Pennsylvania skyrocketed, coinciding with the peak growth of hydraulic fracturing. Pennsylvania counties briefly surpassed New York in employment per capita, reflecting job creation due to the increased shale development.
Chart 5 shows that starting in 2009, Pennsylvania counties exhibited a significant rise in per capita employment, reflecting the job creation effects of hydraulic fracturing. Employment growth extended beyond the energy sector, with ancillary industries, such as transportation, logistics, and local businesses, benefiting from increased economic activity. (Both states declined in the mid-2010s and tracked similarly before and after the pandemic.)
In contrast, New York counties showed relatively flat employment trends starting in 2009. This New York stagnation highlights the opportunity cost of the hydraulic fracturing ban. The ban on hydrofracturing resulted in lower job creation in southern New York than would have been the case if hydrofracturing had been permitted. The data presented in Chart 5 serve as a compelling argument that hydraulic fracturing can drive broader economic benefits, not just in resource extraction but across a region’s entire economy.
Chart 6 displays the total tax returns filed with the IRS per 1,000 residents in the Twin Tier regions of New York and Pennsylvania.
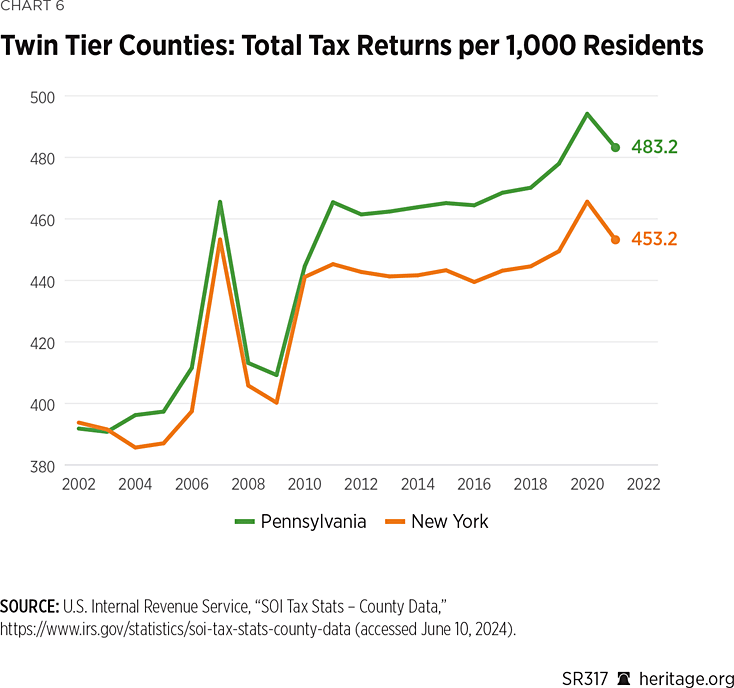
As Chart 6 illustrates, an increase in tax filing reflects a growing number of individuals with taxable income, which suggests expanded employment opportunities, higher earnings, and increased business activity. This pattern is especially pronounced in Pennsylvania, where the surge in tax returns coincides with the expansion of shale development, reinforcing the link between energy production and broader economic growth. In contrast, New York’s Twin Tier counties, which were subject to the fracking ban, exhibit a much slower increase in tax returns, implying fewer new income-generating opportunities. The data underscore that fracking not only drives direct employment in energy extraction but also fuels economic dynamism, encouraging business formation.
Chart 7 displays the adjusted gross income (AGI) per capita for the Twin Tier counties of Pennsylvania and New York from 2002 to 2022, based on IRS tax return data.
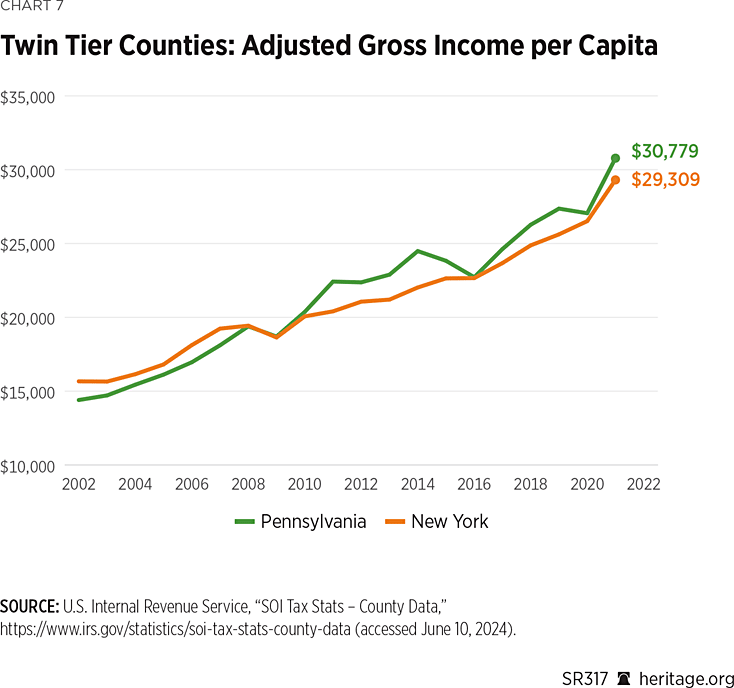
As Chart 7 shows, AGI is a key measure of taxable income, reflecting total earnings from wages, business income, and investment returns before deductions. As discussed, prior to shale development in Pennsylvania, New York counties had a much higher AGI. After 2010, Pennsylvania’s AGI per capita began to outpace that of New York, coinciding with the shale development in those counties. While Pennsylvania did see a small decline between 2014 and 2016, it continued to outperform its New York counterparts thereafter.
Findings
Hydraulic fracturing has been a fundamental component of Pennsylvania’s economic growth. A key question is how much New York would have progressed had it implemented similar policies. In order to assess the economic influence of New York’s hydraulic fracturing ban and the associated counterfactual, the authors estimate a difference-in-differences regression model using GDP per capita as the outcome variable. This approach allows comparison of economic trends in the Twin Tier counties of New York and Pennsylvania before and after the 2010 ban, isolating the policy’s effect from broader economic changes. The model includes an interaction term between the post-ban period and the indicator for New York counties, capturing the differential economic effect of the hydraulic fracturing ban on New York relative to Pennsylvania. By incorporating county-fixed and time-fixed effects, the authors account for unobserved regional differences and common economic shocks, ensuring a more precise estimate of the policy’s consequences. (See Appendix A for details on the model.)
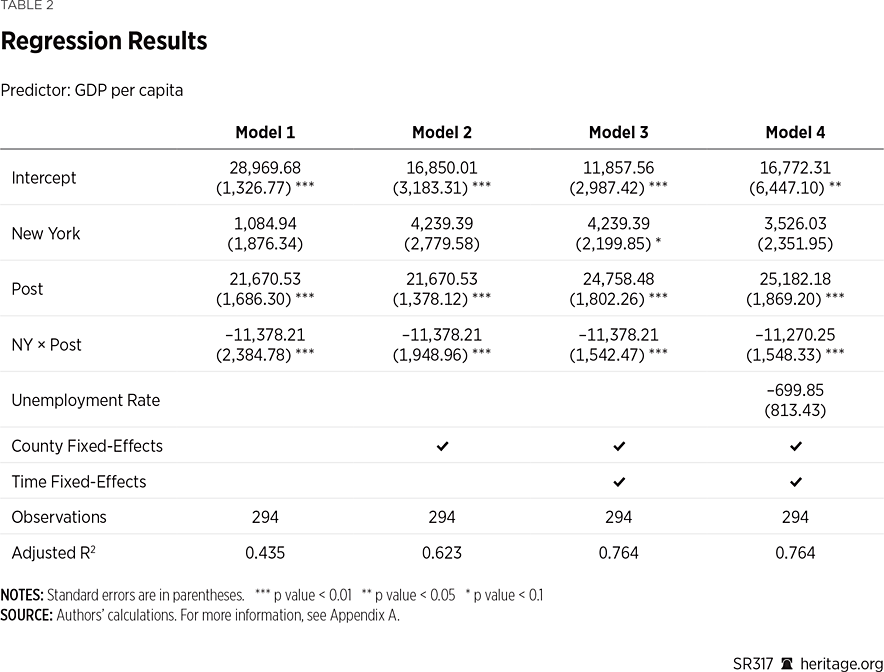
The regression results quantify the economic effect of New York’s hydraulic fracturing ban, with a specific focus on GDP per capita. The key variable of interest, the interaction term NY × Post,REF is consistently large, negative, and statistically significant across all model specifications. This indicates that, after the 2010 ban, New York’s Twin Tier counties experienced a significant relative decline in GDP per capita compared to their Pennsylvania counterparts, with an estimated loss of approximately $11,000 per capita. The inclusion of county-fixed and time-fixed effects in the later models strengthens the robustness of the results by controlling for unobserved heterogeneity and broader temporal trends. These findings strongly support the hypothesis that the economic divergence between New York and Pennsylvania counties was driven by the policy decision to ban hydraulic fracturing. Furthermore, the lack of significance for the Post variable in isolation suggests that the observed effects were not driven by broader economic changes but were specific to the treatment group, further validating the causal effect of the ban on New York’s economic outcomes.
Chart 8 compares the actual GDP per capita for Pennsylvania and New York Twin Tier counties to a modeled “Alternative NY GDP,” which estimates how New York’s GDP per capita might have evolved if the state had adopted hydraulic fracturing policies similar to Pennsylvania’s. The alternative path was calculated using the regression above.
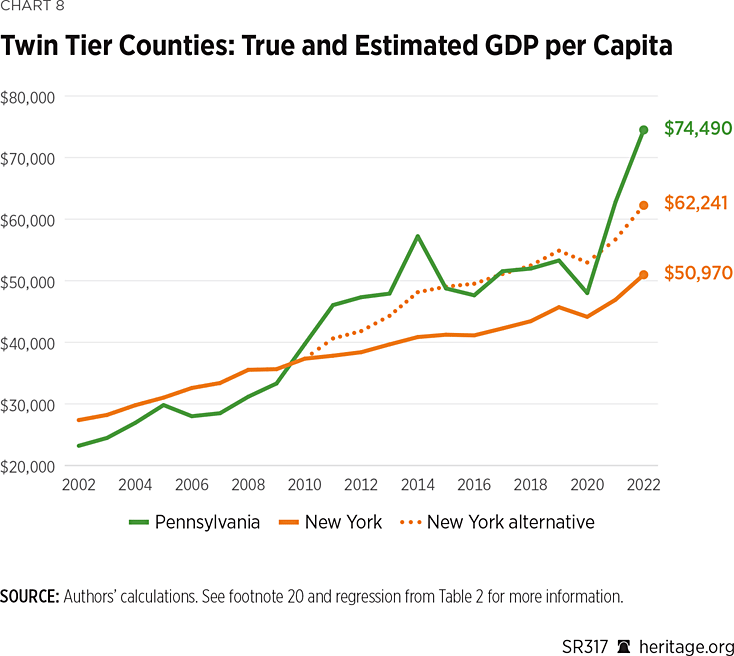
In Chart 8, the true GDP for New York counties (orange line) shows steady but slower growth, while Pennsylvania’s GDP (green line) accelerates sharply after 2010, reflecting the economic benefits of fracking. The alternative projection for New York (dotted orange line) suggests that, had New York embraced hydraulic fracturing, its GDP per capita could have closely mirrored or even exceeded Pennsylvania’s growth. The gap between the actual and projected GDP for New York quantifies the economic opportunity cost of its fracking ban, highlighting how policy decisions directly shaped economic outcomes in the Twin Tier region.
Conclusion
This Special Report evaluates the economic effects of hydraulic fracturing in Pennsylvania and New York, focusing on the Twin Tier region. Using a difference-in-differences approach, the analysis compares the economic outcomes of Pennsylvania’s fracking-friendly policies with New York’s 2010 ban. Data from 2002 to 2022 reveal that New York’s southern counties, which share geological similarities with Pennsylvania’s Twin Tier counties, lost approximately $11,000 in GDP per capita ($27,000 per household) due to the ban. The study also identifies significant job creation and income growth in Pennsylvania as direct and indirect results of fracking, while New York’s ban led economic opportunities in its rural communities to stagnate.
Based on these results the authors conclude that New York lawmakers did not act in the best interests of their constituents by banning hydrofracturing. By overestimating the risk associated with the practice (see Appendix B), they stripped their constituents of lucrative income associated with hydraulic fracturing. Furthermore, the research presented here shows that jobs increased significantly in Pennsylvania counties which fully embraced the practice. Therefore, New Yorkers living in Marcellus Shale counties should urge their lawmakers to lift the ban. Lawmakers in other areas of the United States with fracking bans should also reconsider these unnecessary and economically harmful bans.
Alexander Frei is Senior Research Associate in the Center for Data Analysis at The Heritage Foundation. Diana Furchtgott-Roth is Director of the Center for Energy, Climate, and Environment and the Herbert and Joyce Morgan Fellow at The Heritage Foundation.
Appendix A: Difference-in-Differences
We used a difference-in-differences (DID) regression in order to evaluate the effects of the hydraulic fracturing ban on per capita employment in New York. DID regression is a very popular choice when attempting to isolate the effect of a policy decision. By comparing two similar groups, but only having one group experiencing a “treatment,” it helps to causally explain the effect of the policy. One of the most famous papers using this methodology comes from Nobel Laureate Joshua Angrist,REF in which he estimates the influence of military service on lifetime earnings, using the natural experiment of the Vietnam draft lottery. In a similar fashion, we compare the effects of the New York hydraulic fracturing ban on employment. In our setting we classify New York as having received treatment through the ban. We use 2010 as the start date as this was the year when hydraulic fracturing was ultimately banned.
Yit = β0 + β2pi + β3(ti × pi) + γt + εi (1)
Equation (1) specifies the model we are estimating. represents the treatment group which equals 1 for New York counties and 0 for Pennsylvania counties. pi represents “post-treatment” and is a dummy variable which takes on the value 1 for the time periods after the treatment started (2010 to 2022) and 0 for the pre-treatment period (2002 to 2010). The interaction ti × pi is the coefficient we are most interested in as this represents the effect of the treatment relative to the control group with the time trend removed. γt captures county fixed effects while β0 is the constant. Lastly, εi is the regression disturbance term which is modeled as a first-order autocorrelated process with common values across all states.
A crucial aspect of running a DID analysis is ensuring that the parallel trend assumption holds. This intuitive assumption posits that the dependent variable for both groups—in our case, the Twin Tier counties in New York and Pennsylvania—should exhibit parallel trends before the treatment occurs. Essentially, this means that if the treatment had not been applied, the gap between the treated and control groups would remain constant over time.
While perfect parallel trends are rarely achievable in real-world observational data, our model sufficiently addresses potential confounding trends by incorporating robust controls. The inclusion of county-fixed effects accounts for unobservable, time-invariant factors specific to each county, while time-fixed effects control for temporal shocks and macroeconomic trends that affect all regions uniformly. Although deviations from perfect parallel trends may exist, these comprehensive controls mitigate their effect, and robustness checks confirm the stability of the results. This specification strikes a balance between capturing confounding trends and maintaining interpretability, making it a valid and reliable approach for estimating the treatment effect.
Appendix B: Response to Health Concerns Over Hydraulic Fracturing
The benefits of hydraulic fracturing are clear, but some are worried about its environmental or health effects. Appendix B reviews effects on the climate, land, and health from extracting hydrocarbons associated with hydrocarbon extraction in the Marcellus Shale region and replies to some concerns.
There are concerns that volatile organic compounds and other pollutants may be released into the air or water from the fracturing process. The most apparent health risk is the inhalation of silica while operating a drill well. However, the Occupational Safety and Health Administration (OSHA) already requires the use of respirators in areas of high silica particulates.REF
Environmentalists object to potential excess greenhouse gas emissions that may be associated with hydraulic fracturing. According to the Sixth International Panel on Climate Change, these unburned methane emissions have a global warming potential 28 times higher over a 100-year period than if they were converted to carbon dioxide (CO₂).REF In 2017, gas-leakage rates in the parts of northeastern Pennsylvania that lie above the Marcellus Shale were estimated at 0.4 percent, which is low relative to other regions.REF Not only does hydraulic fracturing offer a pathway to reducing methane leakage, but it also capitalizes on shale gas’s inherent advantage as the cleanest-burning fossil fuel. Thus, the integration of these insights presents a compelling argument for hydraulic fracturing, underscoring it as a pivotal step toward leveraging the environmental advantages that natural gas has over traditional fossil fuels.
According to the Environmental Protection Agency, burned and unburned natural gas made up 39 percent of U.S. greenhouse gas emissions in 2021.REF However, total U.S. emissions from methane decreased by 16.3 percent between 1990 and 2021,REF despite natural gas production nearly doubling from 17.8 trillion cubic feet to 34.5 trillion cubic feet over the same period.REF As the U.S. has shifted from coal to natural gas for power generation, CO₂ emissions have declined due to natural gas emitting 117 pounds of CO₂ compared to 211 pounds for coal per million British Thermal Units (BTUs) generated.REF In fact, electricity generation from natural gas tripled from 639,000 gigawatt hours to 1.8 million gigawatt hours from 2001 to 2023.REF
Other environmental benefits accompany widespread hydraulic fracturing. The amount of land used in the process of hydrocarbon extraction has decreased due to the advent of hydrofracturing and horizontal drilling. For instance, a 640-acre parcel of land in the 1950s would have contained more than 100 wells and 18 kilometers of roads and pipelines, but a similarly size field today only needs a single pad of five acres and less than a kilometer of roads and pipelines.REF
While local air pollution around such sites is almost always within health benchmarks, peaks of hazardous air particulates have occasionally been found during some production stages.REF The Marcellus Shale region’s comparatively elevated salinity was found to be part of the natural shallow groundwater and is not directly related to shale-gas development. Finally, properly outfitted facilities are needed to screen for compounds found in wastewater as high chloride concentrations have been detected downstream from treated shale gas sites which may affect local ecologies.REF Many diseases and health issues, such as a leukemia, heart attacks, asthma, and low birth weight, documented by the National Institutes of Health did not control for other factors, and causation due to shale development has not been proved.REF
Appendix C
