On January 24, 2018, Nobel Prize–winning economist Angus Deaton published an op-ed in The New York Times entitled “The U.S. Can No Longer Hide from Its Deep Poverty Problem.” According to Deaton, 5.3 million Americans are living on less than $4.00 per day and “are as destitute as the world’s poorest people.… [Their] suffering, through material poverty and poor health, is as bad [as] or worse than that of the people in Africa or in Asia.”[REF]
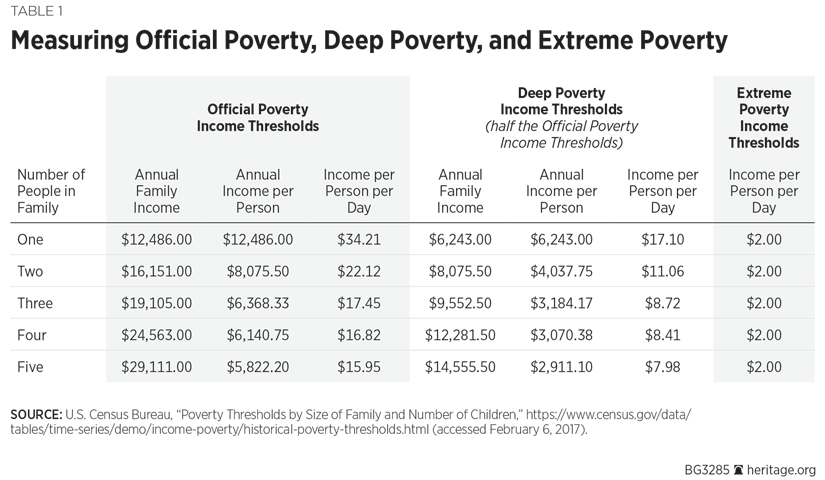
Although Deaton uses the term “deep” poverty to refer to the $4.00-per-person-per-day standard, this would more commonly be called “extreme poverty.”[REF] In other analyses, the term “deep poverty” typically means a household with an income that is less than half of the official U.S. poverty income thresholds. For example, the poverty income threshold for a family of four in 2016 was $24,563. A family would be in “deep poverty” if its income was less than half this amount, or $12,281. This amounts to around $8.40 per person per day, or twice Deaton’s standard.
Critically, the conventional wisdom on the left holds that welfare reform enacted in 1996 (the Personal Responsibility and Work Opportunity Reconciliation Act of 1996) has led to an increase in the number of people—particularly families with children—living in this second type of deep poverty. Arloc Sherman and Danilo Trisi of the Center on Budget and Policy Priorities typify this belief:
In the decade after Congress altered the welfare system in the mid-1990s, the safety net grew more effective at assisting working-poor families with children but less effective at protecting Americans from deep poverty—that is, at lifting their incomes above half the poverty line—and children’s deep poverty increased.[REF]
In reality, analysis of government data on households’ self-reported spending shows that the share of the population living on resources below half of the federal poverty threshold has trended downward over the past three decades, falling from roughly 2 percent to less than 0.5 percent of the total population. The greatest improvements occurred among the group directly affected by welfare reform: single-parent families.
As for Angus Deaton’s claim that over 5 million Americans (or 1.7 percent of the population) live on less than $4.00 per day, this too is wrong. Examination of government household consumption data shows that the number of individuals living on less than $4.00 per day is effectively zero. Since 1980, the Consumer Expenditure Survey (CEX) has reported on the annual consumption expenditures of 222,170 households. Of these 222,170 cases, 175 reported spending less than $4.00 per person per day. That is one household in 1,270. Rather than 1.7 percent of the population living in deep poverty, expenditure surveys show that the figure is only 0.08 percent.
Deaton’s claims of Third World poverty in the U.S. are simply the result of using severely flawed data that omit much of the existing welfare state as well as other economic resources.[REF] His analysis is like studying the world through a cracked microscope: It can tell you a lot about the defects of the microscope but nothing about the real world.
Understanding Poverty, Deep Poverty, and Extreme Poverty
The Census Bureau measures poverty for the previous calendar year based on the current household structure and previous calendar year’s income as reported in its annual March supplement to the Current Population Survey (CPS), the results of which are published in September in its Income and Poverty in the United States report.[REF] These official statistics are based on “money income,” which includes reported earnings; selected cash welfare benefits such as Temporary Assistance for Needy Families (TANF, formerly Aid to Families with Dependent Children) and Supplemental Security Income (SSI); and certain other specific forms of income for each family member who is at least 15 years old.[REF]
To assign the poverty status of a given family, the Census Bureau compares its aggregate money income to the corresponding federal poverty threshold for its structure and size. For purposes of this paper, three levels of poverty can be distinguished: official poverty, deep poverty, and extreme poverty.
- Official poverty. The Census Bureau establishes specific income thresholds for different size families. If a family’s money income falls below the relevant threshold, the family is deemed officially poor. For example, in 2016, if a family of three reported less than $19,105 of money income, the family and each of its members would be considered to be living in official poverty.[REF]
- Deep poverty. Deep poverty is usually defined as having an income less than half the official poverty income threshold. As stated, a three-person family with money income less than $19,105 in 2016 would be deemed officially poor. If their income is less than half of $19,105 (i.e., less than $9,552.50), then the family would be counted as living in deep poverty.
- Extreme poverty. Extreme poverty is generally defined as having a consistent income of less than $2.00 per person per day or less than $4.00 per day per person.[REF] These income thresholds are roughly the same as the international poverty thresholds established by the World Bank.[REF] Individuals with incomes below this level are judged to have living standards as low as the poor in less developed nations.
The official and deep poverty income thresholds for families of different sizes are shown in Table 1. Depending on family size, the official poverty income thresholds in the U.S. are eight to 17 times as high as the extreme poverty threshold of $2.00 per person per day. The official poverty income thresholds are four to eight times as high as Deaton’s extreme poverty threshold of $4.00 per person per day.
Trends in Poverty and Deep Poverty by the Census Money Income Measure
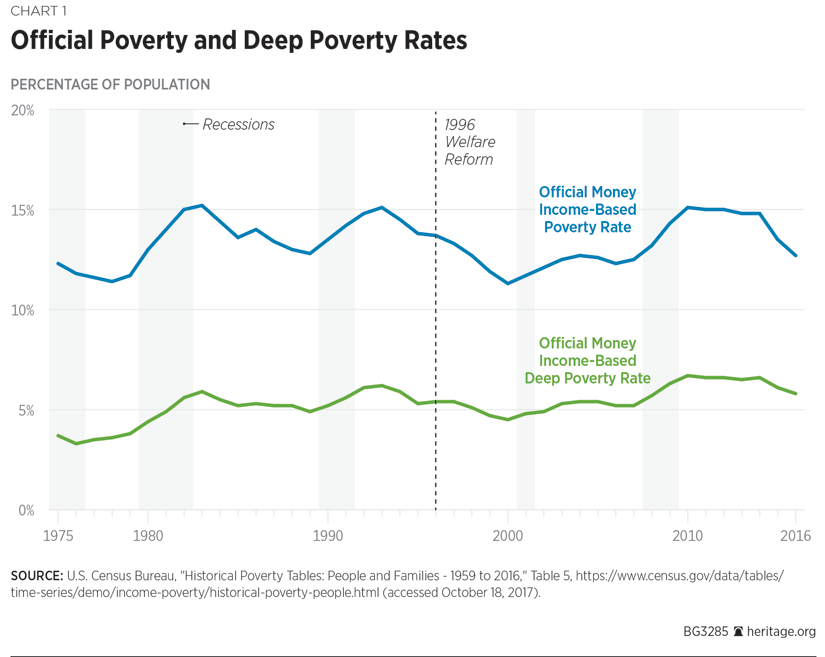
Chart 1 shows trends in official poverty and deep poverty for the whole U.S. population from 1975 to 2016. Over the past four decades, the Census Bureau’s official money income–based poverty and deep poverty rates have fluctuated within the ranges of 11.3 percent–15.2 percent and 3.3 percent–6.7 percent, respectively. Both series increase after the onset of a recession and gradually decline after the economy is well into a period of recovery or expansion. The deep poverty data show a slight trend upward over time.
However, there are two important caveats with respect to these data. First, there are dramatic flaws in the government’s conventional measures of poverty and deep poverty. Second, these figures reflect the whole U.S. population; therefore, they tell us little about welfare reform in the 1990s, which affected only families with children and primarily single-parent families with children.
Flaws in the Official Measures of Poverty and Deep Poverty
There are four major problems with the Census Bureau’s official measurement of poverty and deep poverty:
- Means-tested welfare benefits are almost entirely ignored;
- Extensive informal or gray-market income in lower-income households is omitted;
- An arbitrary definition of the family unit excludes cohabiting partners and their income from the measure of the family’s living standards; and
- Income from a single year may not correspond to living conditions, because some families with temporarily low incomes may have assets acquired in prior years.
Problem #1: Means-tested welfare is almost entirely ignored.[REF] The means-tested welfare system consists of the total spending on cash, food, housing, medical care, and social services in programs targeted toward poor and nearly poor persons. The federal government runs 89 separate means-tested aid programs.
In 2016, federal and state governments spent $1.1 trillion on means-tested welfare. (Social Security and Medicare are not part of the means-tested welfare system and are not included in that spending total.) Of this sum, nearly $829 billion (74 percent) represented federal expenditures, and $297 billion (26 percent) was funded by state governments. Nearly all state government welfare expenditures are contributions to federal welfare programs. Ignoring these matching state payments into the federal welfare system results in a serious underestimation of spending on behalf of the poor.
Of total means-tested spending in fiscal year (FY) 2016, over 59 percent—almost three-fifths—was spent on medical care for poor and lower-income persons, and about 31 percent was spent on cash, food, and housing aid. The approximately 10 percent remaining was spent on social services, training, child development, targeted federal education aid, and community development for lower-income persons and communities.
Roughly half of means-tested spending goes to families with children. Another 41 percent goes to disabled or elderly persons; only 9 percent goes to non-elderly, non-disabled adults without children.
A simple but largely unknown paradox underlies most discussions about welfare and poverty in the U.S.: Official government reports consistently show high levels of poverty and deep poverty primarily because their statistics, for purposes of calculating poverty, omit around 95 percent of welfare state spending. As noted, the Census Bureau defines a family as “poor” based on reported “money income,” but the definition of “money income” excludes most widely available welfare benefits, such as:
- The refundable Earned Income Tax Credit (EITC);
- The refundable Additional Child Tax Credit (ACTC);
- The Supplemental Nutrition Assistance Program (SNAP, formerly the Food Stamp Program);
- The Special Supplemental Nutrition Program for Women, Infants, and Children (WIC);
- Free or reduced-price school breakfasts and lunches;
- Subsidized housing;
- The Low Income Home Energy Assistance Program (LIHEAP); and
- Medicaid, Children’s Health Insurance Program (CHIP), and premium assistance provided under the Affordable Care Act.[REF]
In addition, even in programs that are included in the concept of money income, such as TANF and SSI, actual benefits are substantially undercounted.
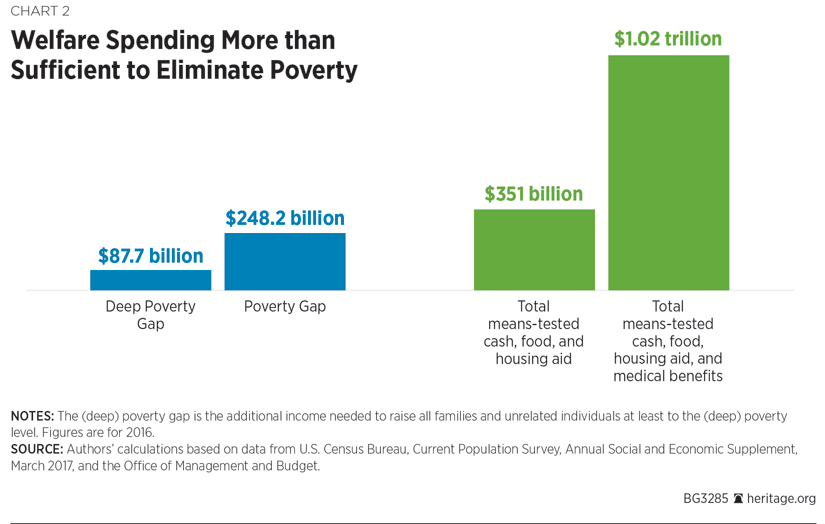
Chart 2 reveals key facts about means-tested spending in 2016. The total amount of money needed to raise all families out of deep poverty was $87.7 billion. The total needed to raise all families completely out of official poverty was $248.2 billion. By contrast, total means-tested spending for means-tested cash, food, and housing aid was $351 billion. In other words, means-tested cash, food, and housing aid was four times the amount needed to eliminate all deep poverty in the U.S. When medical benefits were added, total means-tested spending rose to $1.02 trillion—nearly 12 times the amount needed to eliminate all deep poverty.
Paradoxically, however, out of all that welfare spending, the Census Bureau counted only $58 billion as “money income” for purposes of measuring either poverty or deep poverty. Because the government excludes nearly the entire welfare state for purposes of measuring deep poverty and poverty, it should be no surprise that it reports high levels of both.[REF]
Problem #2: Extensive informal or gray-market income in lower-income households is omitted. While the Census Bureau imputes income to some respondents in an attempt to adjust for the underreporting of earnings from formal employment, it cannot adjust for earnings if the work is never reported to the government at all, even by the employer. Off-the-books earnings are common among low-income persons and welfare recipients. For example, an analysis done in the early 1990s of single mothers receiving AFDC benefits found that each month, around 40 percent of mothers had off-the-books income that they did not report to the welfare office.[REF] Those with off-the-books income reported around $425 per month (in 2016 dollars) in hidden income.[REF]
The Fragile Families and Child Wellbeing Survey is a nationally representative sample of urban parents who had a child born between 1998 and 2000. The survey gives a representative cross-section of young urban fathers and mothers, both married and non-married, at all income levels. Informal employment and earnings were common.[REF] Between 19 percent and 32 percent of urban fathers reported informal or off-the-books earnings during a year; those with informal earnings gained an average of $11,000 in off-the-books income per year at an average effective wage rate of more than $22 per hour. Between 12 percent and 16 percent of urban mothers reported informal or off-the-books earnings during a year; those with informal earnings appear to have gained an average of $4,300 per year in off-the-books income at an average effective wage rate of $14 per hour.[REF] Lower-income mothers—particularly those who receive TANF—are significantly more likely to report off-the-books employment.[REF] Estimates place the total informal or gray market at more than one percent of gross domestic product, or $200 billion per year, most of which would be comprised of cash payments to low or moderate skill workers.[REF]
Problem #3: An arbitrary definition of the family unit excludes cohabiting partners and their income. According to the Census Bureau’s official definition, “A family is a group of two people or more (one of whom is the householder) related by birth, marriage, or adoption and residing together.”[REF] This definition excludes cohabiting partners and parents, foster children, and others from the family and from the calculation of the family’s poverty status, regardless of how closely their finances are intertwined with other members of their household.
The Census Bureau’s narrow definition of the family is most perplexing for cohabiting parents with a common biological child. In this case, the child is a member of the family of whichever parent is designated as the householder, and the other biological parent is not even considered to be a member of the family of his own child, despite living in the same household. The cohabiting parent’s income is considered irrelevant to the family’s living standard and cannot be counted toward raising the family’s income above the federal poverty threshold.[REF]
Problem #4: Annual income often fluctuates and may not correspond to actual living conditions. Family incomes may fluctuate from year to year. If a family experiences a temporary downturn in income, it may compensate by drawing down assets or borrowing. As a consequence, some families that appear to have very low incomes in a year do not appear to have very low standards of living as measured by housing, ownership of cars and other amenities, food consumption, and other variables. Official poverty statistics lump together Americans who are truly impoverished with those who are experiencing a reduction in income with little or no effect on their long-term standard of living.
An Alternative: An Expenditure-Based Measure of Poverty
The Census Bureau also collects, on behalf of the Bureau of Labor Statistics (BLS), data on the spending patterns of American households via the Consumer Expenditure Survey. A nationally representative sample of households is selected to be interviewed for four consecutive quarters and asked, among other things, to report all spending by any member of the household for each month within every one of a comprehensive set of spending categories needed to calculate weights for the Consumer Price Index.[REF] The survey is extremely detailed and includes information on up to 594 non-overlapping categories of expenditures.[REF] Although the survey is conducted on an ongoing basis throughout the year, the results of all surveys pertaining to the prior calendar year are released once a year, usually in late summer.[REF]
Economist Bruce Meyer of the University of Chicago has shown that it is possible to use the CEX data to construct a far more accurate measure of poverty.[REF] For example, the CEX has shown for decades that the households in official poverty routinely report spending roughly $2.40 for every dollar of apparent income. For families in “extreme poverty,” with a consistent income of $2.00 or less per person per day, the expenditure-to-income ratio rises to around $25.00 to $1.00.[REF]
Specifically an expenditure-based poverty measure has advantages relative to the Census Bureau’s official poverty statistics in each of the four problem areas identified:
- Advantage #1: Means-tested welfare counts. After spending $1.1 trillion per year on means-tested welfare, taxpayers deserve to receive official credit for their contribution to poverty reduction. This has become increasingly important as the welfare state has largely transitioned from a system of cash payments toward a system of in-kind benefits (such food stamps) and refundable tax credits (such as the EITC), neither of which is counted as money income and neither of which, therefore, in most circumstances can have any effect on poverty or deep poverty. By contrast, the CEX includes the money that the household reports spending regardless of the source of that income. This means that the additional purchasing power that welfare aid provides to the family is reflected more accurately.
- Advantage #2: Informal income counts. The recipients of off-the-books income are not likely to report that non-regulated income to government surveys. However, this off-the-books income is likely to show up if the family reports its spending accurately. This means that a survey of household spending is far more likely to capture off-the-books income than is a simple survey of self-reported income.
- Advantage #3: Cohabiting partners and parents are counted. Conventional Census income surveys generally ignore the incomes of cohabiting partners and parents for purposes of calculating poverty. By contrast, the CEX generally counts cohabiting adults as part of the household for purposes of measuring household income and poverty. The Bureau of Labor Statistics considers how members of the household share their housing, food, and other expenses when classifying cohabiting couples and other relationships that are not based on blood, marriage, adoption, or other legal arrangements. People who pool their income to make joint expenditure decisions are considered to be a part of the same consumer unit and their poverty status is evaluated together.
- Advantage #4: Expenditures correspond to living conditions more accurately than income does. Bruce Meyer of the University of Chicago and James Sullivan of the University of Notre Dame present a compelling case that if the goal of a poverty measure is “to identify the most disadvantaged and to assess changes over time in disadvantage,” then the Census Bureau’s official money income–based poverty measure is less accurate than a consumption-based measure.[REF] For a given number of “poor” persons, those defined as poor by a consumption/expenditure measure are far more likely to have lower standards of living than are members of the similar-size group defined as poor by an income measure. For example, compared to the income-based poor, the expenditure-based poor tend to live in smaller homes, are less likely to own their homes, drive less expensive cars, are less likely to be covered by health insurance, and are less likely to have a college degree. Overall, the expenditure-based poor appear to be worse off than the income-based poor on 21 of 25 indicators, providing strong evidence that the expenditure-based poverty measure captures the real standard of living more accurately.
Deep Poverty: Comparing Expenditure-Based Measures with Income-Based Measures
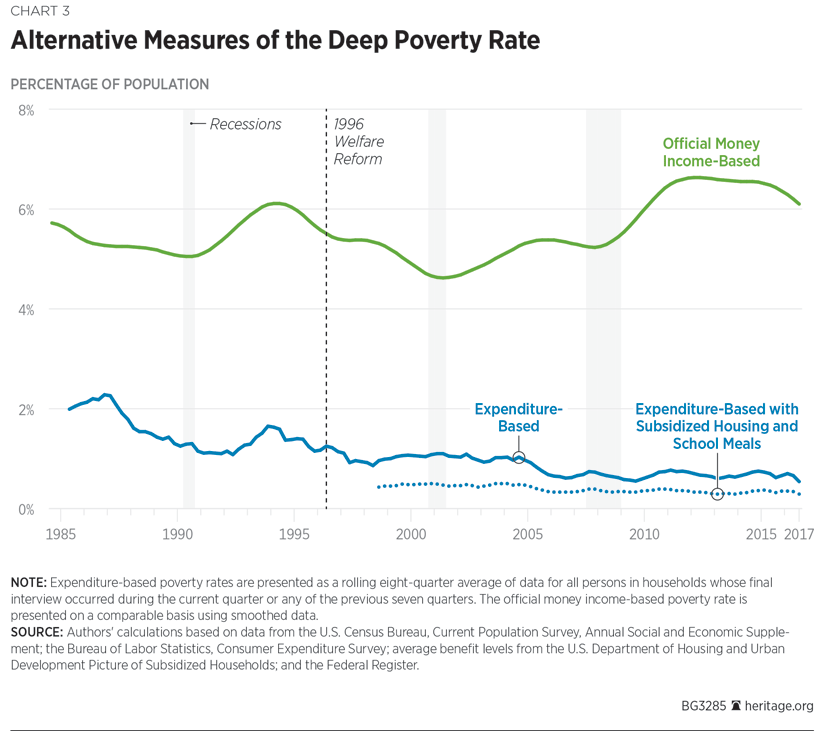
An analysis of government data on American households’ reported expenditures shows that even in the worst of times, the share of the population living with self-reported spending below the deep poverty thresholds has remained substantially lower than the share who are officially considered to be living in deep poverty based on the money income measure. (See Chart 3.)
Moreover, unlike the official money income–based data, the expenditure-based deep poverty rate trends downward over time, falling from roughly 2 percent of the population in the mid-1980s to 0.5 percent today. It drops even further, to 0.3 percent, when the in-kind benefits of subsidized housing and school meals are included; this is shown by the dotted line on the chart. Overall, based on household spending, along with in-kind benefits, roughly 940,000 persons currently fall below the deep poverty level (or below roughly $8.00 per person per day).
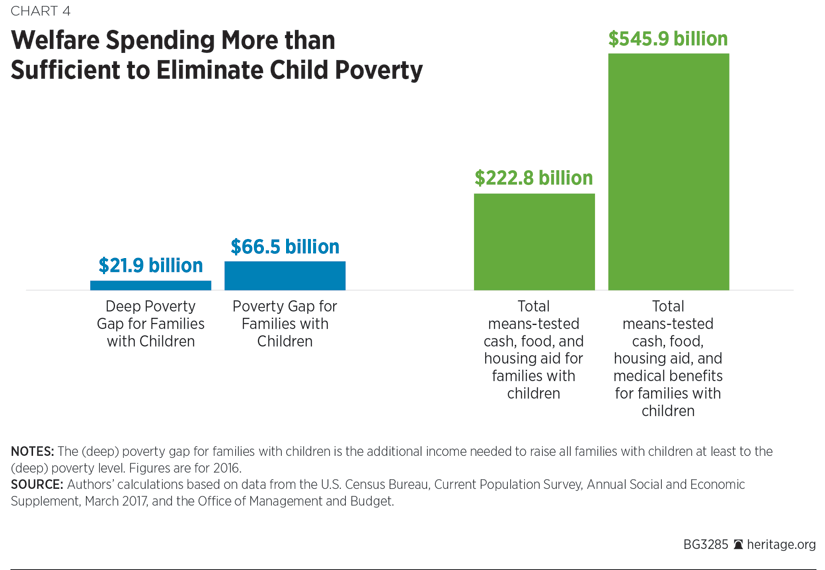
Families with Children in Deep Poverty. Poverty among children is a particularly important public policy concern. Welfare reform in the mid-1990s directly affected families with children rather than the general population. Chart 4 recasts the data presented in Chart 2, but in this case, spending and poverty figures are limited to families with children. Roughly 50 percent of means-tested welfare spending goes to low-income families with children. Cash, food, and housing spending alone on those families in 2015 came to $220.5 billion. When medical care is added, the total came to $454.7 billion.[REF]
In 2016, the deep poverty gap for families with children was $21.9 billion. This means that before receipt of means-tested welfare, it would have taken merely $21.9 billion to eliminate all deep poverty among families with children. At $220.5 billion, cash, food, and housing aid to families with children was more than 10 times the amount needed to eliminate all deep poverty among families with children.
In 2016, the pre-welfare poverty gap for families with children was $66.5 billion. In other words, it would take $66.5 billion to raise the income of every poor family with children up to the poverty level. At $220.5 billion, means-tested cash, food, and housing spending was more than three times the amount needed to eliminate all poverty among families with children. At $454.7 billion, cash, food, housing, and medical spending was more than six times the amount needed to eliminate all poverty among children. However, of the $454.7 billion of means-tested welfare spending on cash, food, housing, and medical care for families with children in 2016, the Census Bureau counted only $7.6 billion—about 1.4 percent—as “money income” for purposes of measuring official, deep, and extreme poverty among children.[REF]
Single-Parent Families Much Better Off Following Welfare Reform. Historically, by all available measures, families headed by unmarried persons with children have experienced poverty and deep poverty at a higher rate than have those headed by married couples with children or those without children. In light of this fact, the purpose of welfare reform was to assist needy families with an improved incentive structure that would reduce out-of-wedlock pregnancies; promote job preparation, work, and marriage; and encourage the formation and maintenance of two-parent families.[REF] The reduction in poverty among single-parent families following welfare reform is evident even in the official poverty data and widely accepted as fact, but the deficiencies in the official data conceal a reduction in deep poverty as well.[REF]
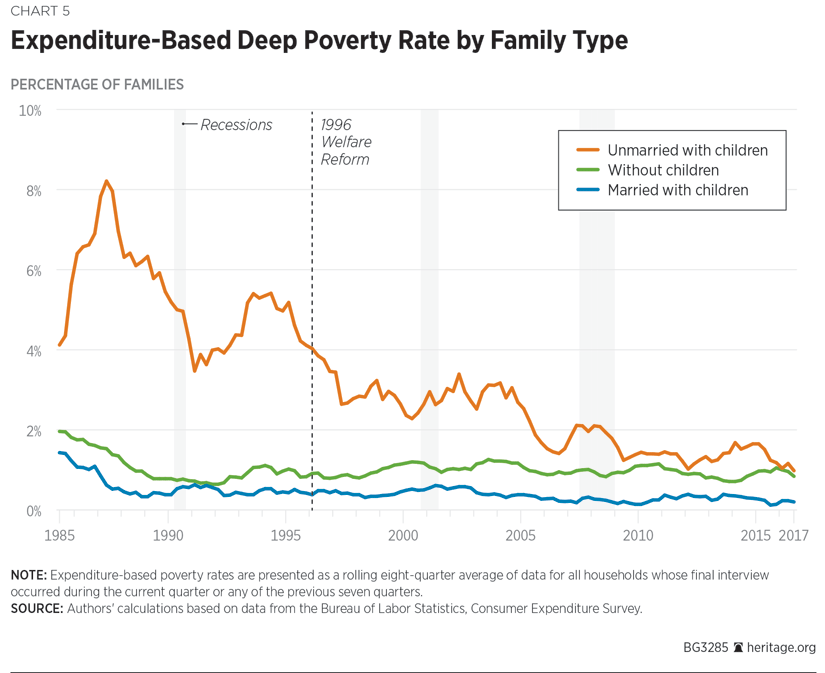
Chart 3 shows trends in deep poverty, defined as an income below 50 percent of the official poverty income thresholds. Expenditure-based calculations show that the deep poverty rate (excluding subsidized housing, school meals, and medical care) fell to a then-record low level within a few quarters following welfare reform and has consistently remained below its pre-welfare reform level as it continues to set new record lows. The probability that such a sustained reduction in deep poverty in the years following welfare reform would have been observed by random chance is only 1 in 65,536.[REF]
As shown in Chart 5, the improvement is largely attributable to families headed by an unmarried person with children, for whom the deep poverty rate (excluding subsidized housing, school meals, and medical care) fell from 4 percent at the time of welfare reform to 3 percent within a few quarters and has continued to decline to 1 percent today. These families now experience deep poverty at a rate comparable to that of those without children.
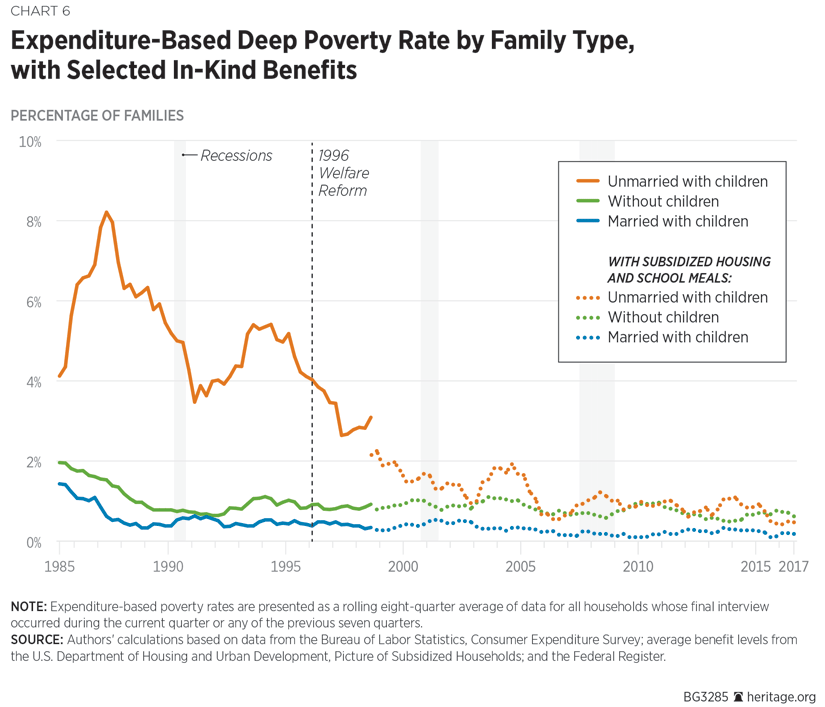
Unfortunately, the value of housing benefits (such as Section 8 vouchers) per beneficiary is not available from the U.S. Department of Housing and Urban Development on a state-by-state basis before the year 1997. As these data become available, the dotted lines in Chart 6 include the dollar value of subsidized housing and school meal benefits. When the value of these benefits is included, the deep poverty rate for families headed by unmarried persons with children falls to 0.5 percent. Despite this remarkable reduction in deep poverty among single-parent families over the past two decades, children of unmarried parents are still more than twice as likely to experience deep poverty as are those of married parents, for whom the already low deep poverty rate is gradually approaching zero.
The Reality of Life in “Deep Poverty” in the U.S.
Due to multiple deficiencies, income-based measures of poverty and deep poverty are very misleading. While our expenditure-based calculations are certainly an improvement in this regard, the Census Bureau occasionally collects additional data that provide an even more complete picture of living standards through a topical module on well-being within the Survey of Income and Program Participation (SIPP).[REF]
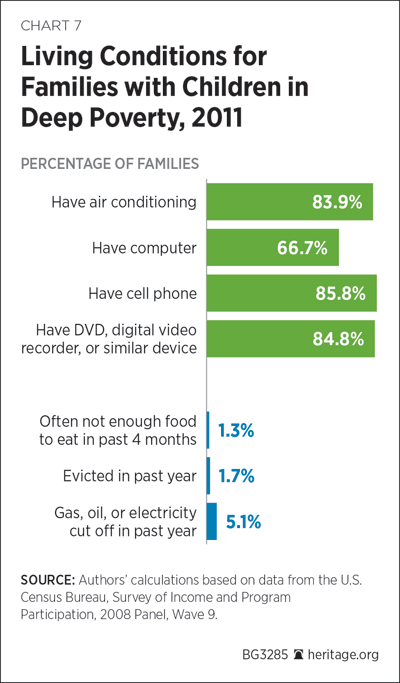
SIPP is an income-based survey that also collects data on physical living conditions. As Chart 7 shows, families with children living in “deep poverty” according to their income typically report that they are able to meet all of their essential expenses, are satisfied with their home and its state of repair, and go to the doctor or dentist as needed. Most have air conditioning, a cell phone, a computer, and a DVD player or similar device. Few have been evicted from their home or even had their utilities disconnected for non-payment. Hunger is rare.
Moreover, analysis shows that those who are classified as living in deep poverty are not significantly worse off than others who are have incomes below the official poverty thresholds but above the deep poverty thresholds on any of the 41 available measures of well-being. On the contrary, by some measures, the deep poor are significantly better off than the other poor, being less likely to report dissatisfaction with the warmth of their home in the winter or problems with its plumbing. This reinforces the general view that the income-based deep poverty concept does not accurately reflect real living standards.[REF]
Deaton’s Claim of Third World Poverty in the U.S.
What about Angus Deaton’s claim that 5.3 million persons in the U.S. (or 1.7 percent of the U.S. population) are living on incomes of less than $4.00 per day? Data from the Consumer Expenditure Survey can readily examine this claim as well. Since 1980, the CEX has reported on the annual consumption expenditures of 222,170 households. Of these 222,170 households, 175 reported spending less than $4.00 per person per day.[REF] That is one household in 1,270. Rather than 1.7 percent of the population living in deep poverty, expenditure surveys show the figure to be 0.08 percent. Moreover, examination of the 175 cases suggests that most are reporting glitches or anomalous situations such as families stating they paid nothing for rent or a mortgage during the year.[REF]
The bottom line is clear: Deaton’s alarming conclusions are driven by the radical flaws in the income surveys being used.[REF] Since he is an honest investigator, one must assume that he is unaware of the glaring deficiencies in the data he is reporting.
The Future of Welfare Reform
Debates about welfare in the United States often degenerate into a fiscal tug of war in which the left seeks to expand conventional welfare spending while the right seeks to shrink it. It is true that the welfare system is far larger and more costly than the public imagines. There is extensive waste and fraud throughout the system.
But the most important problem in welfare is its harmful effects on the poor themselves. The current welfare system undermines self-sufficiency and pushes individuals toward the margins of society. It undermines work and attacks marriage; in so doing, it strikes at the roots of human happiness and well-being. The principal goal of welfare reform, therefore, should not be simply to increase or decrease spending. Instead, the goal of reform must be to transform the goals and content of welfare programs so that they truly benefit the poor.
Three key reform policies are needed to achieve this transformation:
- Able-bodied non-elderly adults who receive most means-tested aid should be required to work or prepare for work as a condition of receiving assistance;
- The penalties against marriage that are imbedded in the welfare system should be sharply reduced or eliminated; and
- Programs that are intended to improve behavior or human capacity (such as drug treatment and prison anti-recidivism programs) should be shifted from the current payment-for-service mode to a payment-for-outcome structure.
Measurements of official poverty, deep poverty, and extreme poverty based on income are deeply flawed because income surveys omit or severely undercount most means-tested welfare assistance; omit or undercount off-the-books earnings, which are prevalent in low-income communities; omit the incomes of cohabiting partners and parents; and ignore assets acquired in prior periods. Some analyses seek to compensate for missing data on welfare benefits by imputing aid into income surveys; these exercises are inevitably arbitrary and inevitably result in undercounted and misallocated benefits. Misimputation of EITC and ACTC benefits that cost taxpayers $95 billion per year are particularly prevalent.[REF] In fact, the government has no clear sense of who gets these benefits because fraud is prevalent.[REF]
A more accurate picture of the actual economic resources of low-income households can be obtained from the annual Consumer Expenditure Survey. This survey contains self-reported expenditures from households for each month. Because the expenditures reported are quite detailed, it seems implausible that the information is simply fabricated by respondents. The self-reported expenditure data indirectly capture much of the income and many of the benefits that are missing in normal Census income surveys. The Consumer Expenditure Survey shows that low-income households routinely report $2.40 in expenditures for every $1.00 of reported income.
The Consumer Expenditure Survey shows that extreme poverty (whether measured at $2.00 per person per day or $4.00 per person per day) is not statistically different from zero. For decades, virtually no families have reported spending less than $4.00 per person per day.
The expenditure surveys also show that deep poverty (measured as having expenditures less than 50 percent of the official poverty income thresholds or roughly $8.00 per day) is rare and declining. The deep poverty rate has fallen over the past three decades from about 2 percent to 0.5 percent or less of the U.S. population.
Both official poverty and deep poverty have declined most sharply for the group affected by welfare reform in the 1990s: single parents with children. The deep poverty for these families has fallen from 4 percent to 5 percent before welfare reform to 1 percent today. If housing aid and school nutrition aid are counted, the rate drops to 0.5 percent.
The actual living conditions of households living in deep poverty are surprising. For example, families with children living in deep poverty (based on income measures) typically have air conditioning, computers, DVD players, and cell phones. These families rarely report material hardships such as hunger, eviction, or having utilities cut off.
Claims of extreme poverty and widespread deep poverty are based on faulty information. They promote alarmism that generates pressure to increase welfare spending and benefits. But sound public policy cannot be based on misinformation. Even worse, misinformation distracts attention from the real issues facing the welfare state: the prevalence of self-defeating and self-limiting behaviors such as low levels of educational attainment, low levels of marriage and work, criminal activity, drug and alcohol abuse, and poor home environments for children. These conditions generate a need for welfare assistance in the first place and undermine human well-being.
—Jamie Bryan Hall is Senior Policy Analyst in the Center for Data Analysis, of the Institute for Economic Freedom, at The Heritage Foundation. Robert Rector is Senior Research Fellow in Domestic Policy Studies, of the Institute for Family, Community, and Opportunity, at The Heritage Foundation.


