Some believe that there is a connection among climate change, ozone in outdoor air, and health effects, including asthma. The U.S. Environmental Protection Agency (EPA) released a report in 2020 titled Integrated Science Assessment (ISA) for Ozone and Related Photochemical Oxidants.REF The report is 1,468 pages long and discusses the science for these substances. The EPA says that the report provides critical evaluation and integration of evidence on health effects to support its review of air quality standards for ozone.
Carbon monoxide, methane, oxides of nitrogen, and volatile organic compounds are considered ozone precursors. Emissions of these substances can lead to production of ozone at the earth’s surface under certain conditions. The EPA claims that, in the future, an increase in the abundance of ozone from climate change will lead to health effects.REF One of these effects is asthma.
The EPA also claims that people with asthma are known to be especially susceptible to the effects of ozone exposure.REF It considers respiratory effects, including asthma, as the key health effects for ozone from both short-term and long-term exposure. A short-term exposure is something lasting for minutes or hours. A long-term exposure is something lasting for years.
For short-term exposure, the EPA uses results from controlled human exposure studies (i.e., chamber studies) and animal toxicology studies to claim that ozone can cause lung function effects. The EPA uses results from epidemiology studies (called observational studies) to claim that ozone levels in outdoor air are associated with a range of respiratory effects, including asthma attacks. For long-term exposure, the EPA uses results from observational studies and animal toxicological studies to support its claim for the onset of asthma.
However, the National Institutes of Health (NIH) states on its website, “The exact causes for developing asthma are unknown and may be different from person to person.”REF Given that the NIH has more medical expertise than the EPA does, its views should be taken seriously.
The science and observation data behind the EPA’s claims need to be understood to establish whether there is a connection among climate change, ozone, and asthma. As will be shown, many of its claims are not supported by science or the observation data. The NIH may have a stronger position.
The Climate Change–Ozone Hypothesis
One hypothesis of climate change prediction models involves an increase in surface ozone levels in the future at locations with greater human-related emissions of ozone precursors (i.e., in cities).REF In addition, prediction models have suggested that, in the absence of any interventions, the number of air quality monitoring stations in the United States violating the current ozone National Ambient Air Quality Standard will double by 2050.REF These developments will supposedly lead to an increase in allergic illnesses, including asthma symptoms.REF
The Heritage Foundation recently conducted an expert review of climate change prediction models compared to observations.REF The review noted that the observed rate of surface air temperature increases over the past 50 years has been unremarkable and much weaker than predicted by almost all the climate models.
Further, the EPA’s own data for emissions of ozone precursors and ozone levels mostly show different trends to what climate change models are predicting in the future:
- Based on EPA inventory data,REF national emissions for two ozone precursors—carbon dioxide and methane—have only increased by 5.6 percent and decreased by 16 percent, respectively, over the 25-year period 1990–2015.
- Also based on EPA inventory data,REF national emissions for two other ozone precursors—oxides of nitrogen and volatile organic compounds—have decreased by 52 percent and 43 percent, respectively, over the 33-year period 1980–2013.
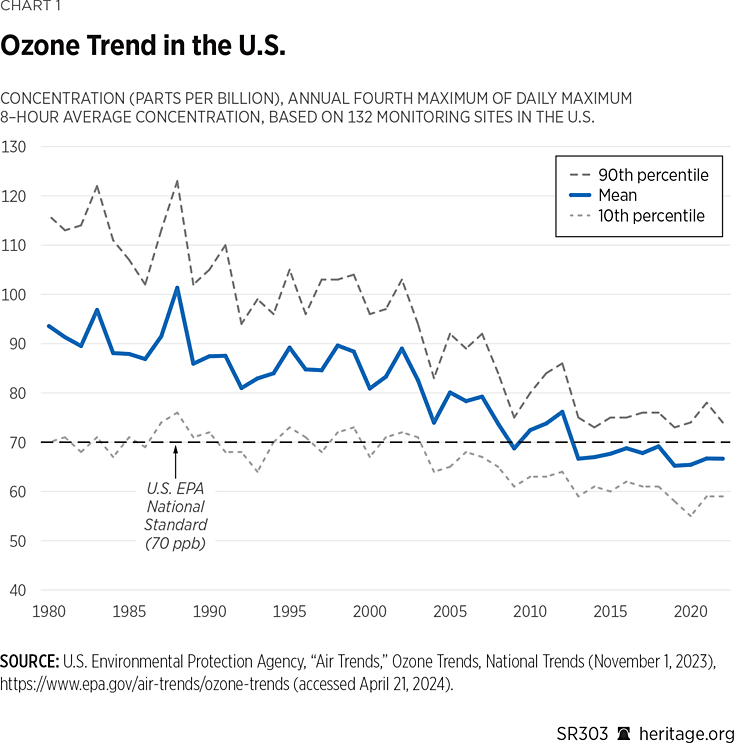
- Chart 1 shows the air quality national trend for ozone over the 42-year period 1980–2022 based on observations from 132 monitoring sites in the United States as reported by the EPA.REF Mean ozone concentrations over this period have steadily decreased by 7 parts per billion (ppb) per decade.
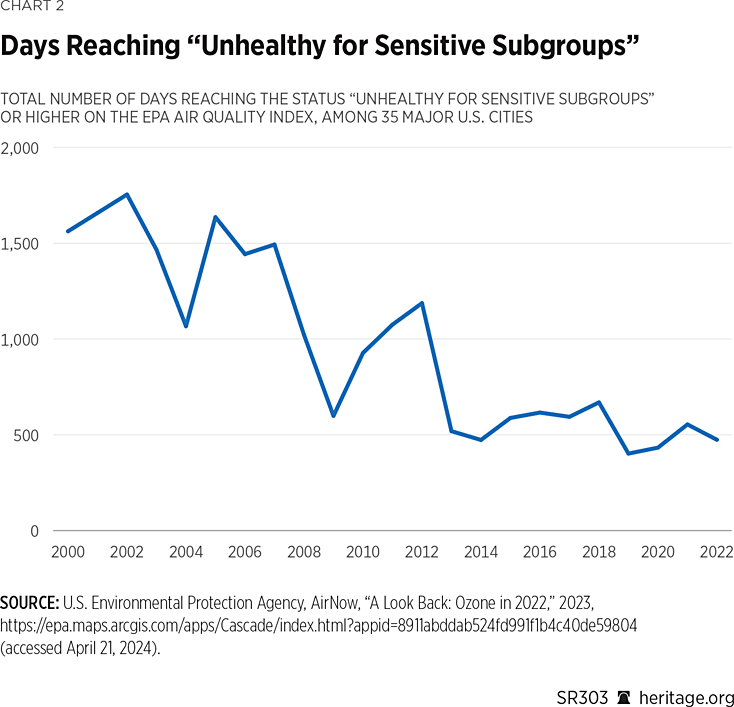
- Chart 2 shows the EPA-reported trend in total number of days reaching “Unhealthy for Sensitive Subgroups” or above for ozone based on their Air Quality Index among 35 major U.S. cities over the 22-year period 2000–2022.REF The total number of days reaching “Unhealthy for Sensitive Subgroups” or above over this period has steadily decreased by 600 days per decade.
EPA inventory and observation data imply that predictions of future ozone levels and of numbers of air quality monitoring stations violating the current ozone standards because of future changes in climate need to be treated with skepticism. Any theorized impact on air quality from climate change models is dwarfed by other factors.
The Ozone–Asthma Hypothesis
Ozone is one of the most well-studied airborne substances. Initial speculation about its health effects dates to the mid-1800s.REF As a small molecule, it is a very reactive gas and strong oxidant. Naturally there is a belief that if a sensitive person is exposed to it under certain conditions, it must cause some type of immune or respiratory response.
Asthma frequently first expresses itself early in the first few years of life arising from a combination of factors. An asthma trigger causes inflammation (a natural response of the immune system). Asthma attacks involve reversible narrowing of the airways, wheezing, shortness of breath, and chest tightness or pain.
These symptoms are hypothesized to occur when an asthmatic (with underlying chronic airway inflammation) experiences an acute inflammatory response.REF Although inflammation appears to play a role, how inflammatory cells interact and how this interaction translates into asthma symptoms is uncertain.REF
The underlying mechanisms by which short-term exposure to ozone could affect asthma severity are unknown. Existing data are not adequate to assess whether the hypothesized mechanisms occur at typical ozone levels or if they are only high-exposure mechanisms.REF As for long-term ozone exposure, the underlying mechanisms of asthma development are also not fully understood.REF So it remains uncertain whether any claimed ozone-caused effects are direct contributors to asthma.
The Immune System. The immune system has a key role in the onset and severity of asthma. Ozone does not have the structure to trigger an immune response. What is understood, however, is that allergic responses and asthma symptoms are related.REF
Allergens cause antibodies to form, and, by their nature, antibodies do respond to simple, small molecules. Allergen responses and asthma symptoms occur from exposure to complex carbon-based molecules. These include plant pollen and animal proteins mostly with surfaces that promote the formation of antibodies.
When exposure to an allergen occurs—through the air or food or from skin contact—antibodies called Immune Globulin E (IgE) are formed. When IgE antibodies are present, subsequent exposure with the allergen results in an IgE complex forming. This complex causes a release of histamine, the triggering chemical for an allergic reaction.
Histamine can cause a variety of responses. These include smooth muscle contraction, blood vessel dilatation, itching, sneezing, wheezing, rashes, nausea, vomiting, and diarrhea—or the most severe forms of reaction: anaphylaxis (collapse of the blood vessels so blood pressure drops) or upper respiratory tract tissue swelling that causes potentially lethal airway blockage.
Although respiratory allergic diseases are mostly well known, food allergies are noted for being more severe and causing anaphylaxis. Even exercise in an ozone-rich environment cannot worsen asthma symptoms or cause asthma. Exercise is a trigger for asthma symptoms.
Hospital admissions and emergency room visits due to asthma attacks are associated with many meteorological factors.REF More hospital admissions of children due to asthma attacks occur in fall and winter than in summer months.REF Summer is when ozone levels are highest. Allergies and asthma symptoms are also triggered by pollen. Plant pollens are at their highest levels during spring and fall.
There is a reasonable theory of asthma in which early exposure to potential allergens reduces the chance of allergic disease.REF A decades-old theory that has increasing status is that children who are exposed to “dirty” environments are less likely to suffer from allergies.REF This theory fits with a well-known therapy for allergic disease called desensitization.REF This therapy involves exposing an allergic person to a triggering allergen in small amounts and then in increasingly larger amounts over time to moderate the allergic response or even extinguish it.
Children who grow up in dirty environments and are exposed to complex carbon-based molecules early in life have less allergic disease and asthma symptoms later in life, and children raised in very allergen-free environments early in life end up being more prone to allergic diseases and asthma symptoms later in life.REF People with allergies benefit from desensitization therapy with gradual increases in their exposure to problem allergens to reduce or extinguish their allergic sensitivity.
Chamber Studies with Ozone
Chamber studies of ozone exposure have been conducted using asthmatic adultsREF and healthy young adults without asthma or other respiratory impairments.REF Exposures were to filtered air with ozone added in at controlled levels for one to eight hours. These conditions are artificial. Real-world exposures are not to ozone alone. The numbers of subjects in these studies tended to be small, ranging from five to 30 in asthmatic studies and 30 to 60 in non-asthmatic studies. Most of the studies had the subjects exercising for different durations with rest periods in between.
A FEV1 test is a measurement of the ability to expel air from the lungs. During this test, a subject breathes forcefully into the mouthpiece of a spirometer machine. The machine measures the amount of air exhaled in the first second.
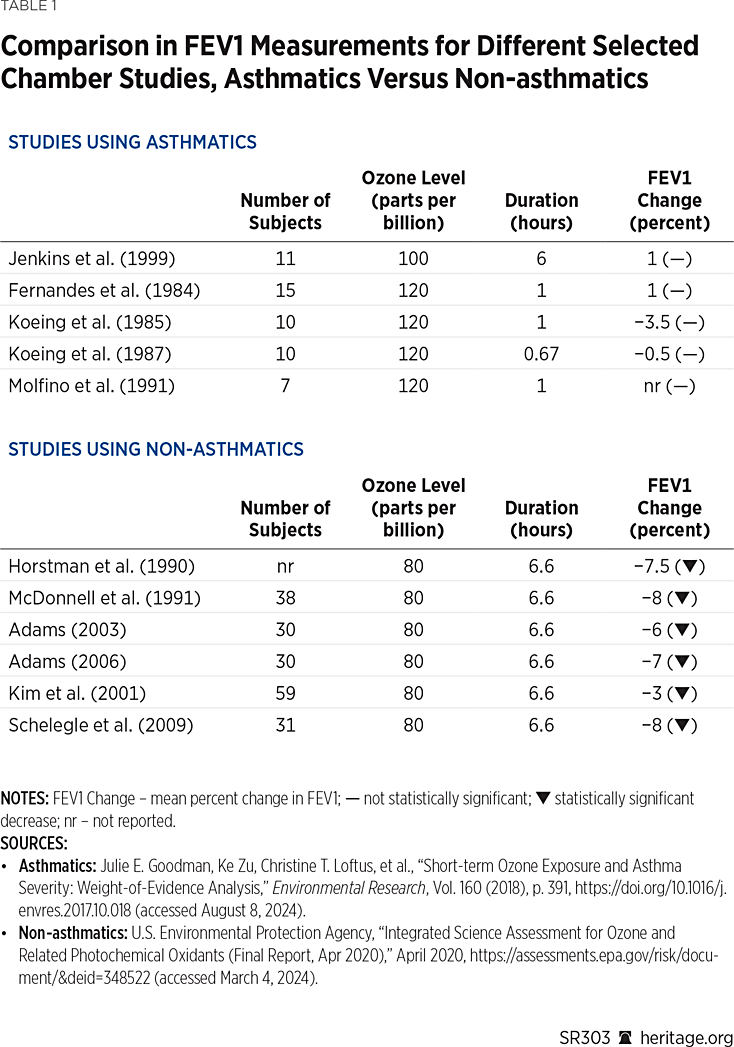
A comparison of percentage change in FEV1 measurements before and after ozone exposure for different selected chamber studies using asthmatics and non-asthmatics is shown in Table 1. The studies on asthmatics in Table 1 used ozone exposure levels ranging from 100 ppb to 120 ppb and were of shorter durations (0.67 to six hours). The studies on non-asthmatics used ozone exposure levels of 80 ppb and were longer (6.6 hours).
The chamber studies on asthmatics listed in Table 1 show no statistically significant change in mean percent FEV1 measurements before and after ozone exposure. The non-asthmatic chamber studies in Table 1 all reported statistically significant decreases in mean percent FEV1 measurements before and after exposure. What may be happening here?
Exposure to ozone levels under controlled conditions were higher in the asthmatic studies (100 ppb–120 ppb) compared to non-asthmatic studies (80 ppb). Also, asthmatics exercised for shorter durations and had more frequent rest periods compared to the non-asthmatics. This difference may explain some of the apparent inconsistency across the study groups. However, there are other plausible factors—confounding factors—that should be considered.
Confounders:
Other Triggers. An unaccounted factor for the asthmatic studies is other triggers. Most of the asthmatic studies in Table 1 did not collect information on all potential contributing exposures to asthma symptoms.REF For example, stress or aeroallergen exposures might have occurred to asthmatics between the study exposure periods. This would contribute to within-subject variability in FEV1 measurements of the asthmatics. Regardless, these exposures had no effect on study results presented in Table 1 for the asthmatics.
Awareness Bias. A more subtle confounder is awareness bias: a subject self-reporting a symptom because of prior knowledge of an environmental hazard that may cause the symptom.REF Ozone has a distinct, acrid odor, and exposures in the chamber studies were well above the odor threshold (in the range of 7 ppb–20 ppb).REF So subjects in all chamber studies were likely aware of when they were being exposed to ozone rather than filtered air. This may have led some non-asthmatic subjects to alter their behavior and exert less effort on spirometry tests, thus biasing FEV1 results to show decreases. This was not an issue for asthmatics (see Table 1) as no statistically significant FEV1 changes were observed in the chamber studies.
Measurement Variability. Another confounder is bias from FEV1 measurement variability (error). Between-instrument variability—the deviations in FEV1 measurements using different spirometry instruments—was ±5.1 percent for different spirometry instruments in a large 10-country study of school children.REF
Within-subject variability—the variability of a spirometry measurement on a subject—was tested in a repeatability study of spirometry measurements in 18,000 adult patients.REF Fifty percent of the patients were able to reproduce FEV1 measured values within ±3 percent, whereas 95 percent of the patients were able to reproduce FEV1 measured values within ±8.2 percent.
Mean FEV1 decreases for non-asthmatics in Table 1 varied from 3 percent to 8 percent for 80 ppb exposures across these studies. However, FEV1 measurement error from the combined components of between-instrument variability (±5 percent) and within-subject variability (±3 percent) is ±8 percent. This error is large enough that non-asthmatic study results in Table 1 should essentially be treated as transient—that is, they have no residual effect.
External Validity. An even more important confounder is the applicability of the non-asthmatic study results to asthmatics, an issue known as external validity. Specifically, external validity refers to whether research findings are generalizable to similar individuals or populations.REF Although some of the chamber studies measured lung function and asthma symptoms, the clinical significance of their findings to real asthma attacks in asthmatics is unclear. While symptoms may be associated with decreased lung function, changes in measured lung function in non-asthmatic chamber studies do not necessarily relate well with acute asthma attacks.REF
In addition, temporary lung function decreases or increases in asthma symptoms are not necessarily triggers or precursors of real asthma attacks.REF Temporary lung function decreases or increases in respiratory symptoms that resolve quickly with or without treatment in asthmatics are not necessarily associated with a worsening disease status or loss of asthma control in the short or long term.
Lung function declines reported for non-asthmatic, healthy subjects exercising in chambers at ozone levels of 80 ppb (see Table 1) are essentially transient. These declines are questionable, and they are not indicators of asthma attacks in asthmatics. Given the nature of asthmatics and their airway hyperactivity and sensitivity, chamber studies of healthy non-asthmatics exercising do not establish ozone exposures as proof of causation of asthma or asthma symptoms.
Epidemiology Studies with Ozone
The EPA uses information from environmental epidemiology studies (called observational studies) to support the ozone–asthma hypothesis. These studies are not founded on proven biological plausibility of ozone causing asthma symptoms or onset of asthma. They are founded on a concept—an assumption—of what may be a cause of respiratory disease and harm. There are problems with these studies as well.
Statistical Associations. Weak statistical associations are a problem in observational studies. Almost 20 years ago a commentary in the International Journal of Epidemiology opined that “epidemiology was once a legitimate science of disease causation, but no longer” and that “we have found all the strong associations, with only the weak left to be discovered.”REF Weak associations are more susceptible to bias, confounding, and chance.REF As will be shown, observational studies of ozone–asthma associations are no different.
Observational studies use exposure-response estimation models to analyze ozone-health-effect data. These models cannot address the complexities of people’s exposures. They represent only groups of people. The models do not consider individual behaviors and exposure to other factors and real-world confounders that can affect asthma.
Individual exposure to ozone is strongly determined by personal behaviors such as time spent indoors versus outdoors; time spent at work, home, or school; and indoor air ventilation systems. Observational studies use data from stationary ozone monitors to estimate people’s exposures.
Data from the monitors assume constant exposures for a given period of time. Levels recorded by the monitors do not account for differences in individual-level exposure. As a result, the confluence between a person’s ozone exposure and what is measured by a stationary monitor is very low.REF This introduces a large degree of exposure uncertainty in observational studies.
For any observational study to offer meaningful results, quantitative risk results—for example, relative risks or odds ratios—need to be high enough in the presence or absence of confounders and moderating factors. It is well-established in literature that relative risks greater than 2.0–3.0 are needed to rule out bias and confounding.REF
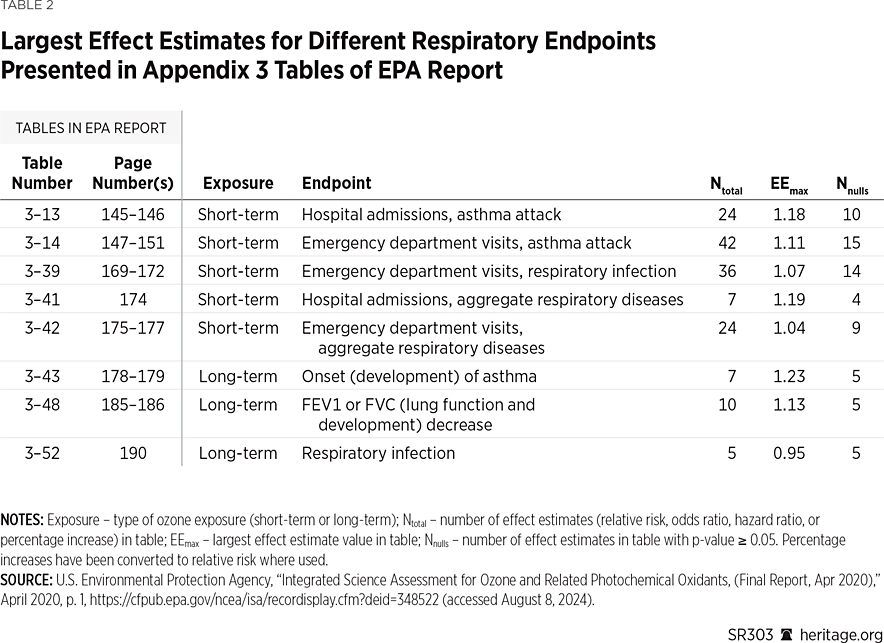
Quantitative results for respiratory effects (i.e., endpoints) are presented in tables in Appendix 3 of the EPA report.REF These results—called effect estimates—are expressed as relative risks, odds ratios, hazard ratios, and percent increases along with 95 percent confidence limits. Table 1 shows the largest effect estimates (EEmax) for eight different respiratory endpoints from 155 effect estimates presented in the EPA Appendix 3 tables. All the effect estimates are weak: closer to 1.0 and well less than 2.0. In addition, 67 of the 155 effect estimates had lower 95 percent confidence limits that include 1.0. This means that the effect estimates are not significant.
It is a disservice to observational epidemiology to search for, report, and attempt to defend weak statistical associations.REF Weak associations do not prove causality,REF and they are often complex and influenced by other known and unknown confounders.REF
Multiple Testing. Another problem with observational studies in Appendix 3 of the EPA report is that they are affected by multiple testing. This bias is created by testing many statistical hypotheses and using multiple models without a multiple testing correction. This bias is also called multiple comparisons or multiplicity in scientific literature.
This bias occurs when a data set is used to test multiple outcomes, multiple predictors, different population subgroups, multiple statistical cause–effect models, or multiple confounders to cause–effect associations. These studies tend to produce more false-positive results. Environmental epidemiologists typically do not correct for multiple testing, so any published study that does not make corrections is unreliable. Two papers in 1988 alerted epidemiologists to the multiple testing problem.REF The field of epidemiology has ignored the problem ever since.
The number of statistical hypotheses tested in a study can indicate the potential for multiple testing bias. Some examples of multiple testing related to asthma studies are helpful. Possible numbers of hypotheses tested in observational studies of asthma attack outcomes and onset of asthma have been recently reported:
- Asthma attack: median (interquartile range) of 17 random selected studies = 15,360 (1,536–40,960).REF
- Onset of asthma: median (interquartile range) of 19 random selected studies = 13,824 (1,536–221,184).REF
These high numbers show that it is possible in ozone–asthma observational studies to test more than 10,000 hypotheses on a data set. None of these studies made corrections for multiple testing bias. In addition, the 36 studies mentioned above did not present all their results. Typically, these studies presented only a few dozen or fewer than 100 results. It is known that observational studies have a bias for highlighting statistically significant findings and avoiding highlighting of non-significant findings. This bias is known as selective reporting.REF
Reproducibility. It is recognized that far too many published research claims are irreproducible or false.REF Results for statistical hypothesis tests in observational studies are normally presented as relative risks or odds ratios with 95 percent confidence intervals. The tests are done on a data set to determine whether a significant or non-significant correlation exists between two variables—for example, inferred ozone exposure and asthma attacks. This allows a researcher to make a claim if a significant association is found between the variables. But are these claims reproducible? One way to answer this is to use p-value plots.
A p-value is a number also calculated from the same data set. It describes how likely it is to have found a particular result if a non-significant association between the two variables were true. Relative risk, odds ratio, confidence interval, and p-value quantities are calculated from the same data set. They are interchangeable, and one can be calculated from another.REF
The p-values for a set of hypotheses tests can be displayed in a p-value plotREF according to rank (smallest to largest). The plot is used to visually check the heterogeneity of test statistics addressing the same research question or claim—for example, that ozone exposure causes asthma attacks. The plot can be used to test the reproducibility of a claim. The plot is well-regarded, being cited more than 500 times in scientific literature.REF
There are several ways to interpret p-value plots:REF
- If p-values fall approximately on a 45 degree line in the plot, it suggests a good fit with the theoretical (uniform) distribution. Such a trend represents a distinct (single) sample distribution for no association between tested variables.
- If p-values are mostly less than 0.05 and fall on a line with a shallow slope in the plot, there could be a real, non-random association between tested variables. Such a trend represents a distinct sample distribution for true effects between two variables.
- In the absence of biases, deviations from a near-45 degree line for the p-values may also indicate departures from the uniform distribution and a real, non-random association between tested variables. The key is the absence of biases that might occur using sound research practices (good study technique, randomization, blocking, blinding, and unbiased peer review, among others).
Some examples of reproducibility in ozone–asthma observational studies are helpful. The reproducibility of two ozone–asthma claims was tested with p-value plots:
- Short-term ozone exposure leads to more childhood hospital admissions and emergency room visits due to asthma attack.
- Long-term ozone exposure leads to more cases of onset of childhood asthma.
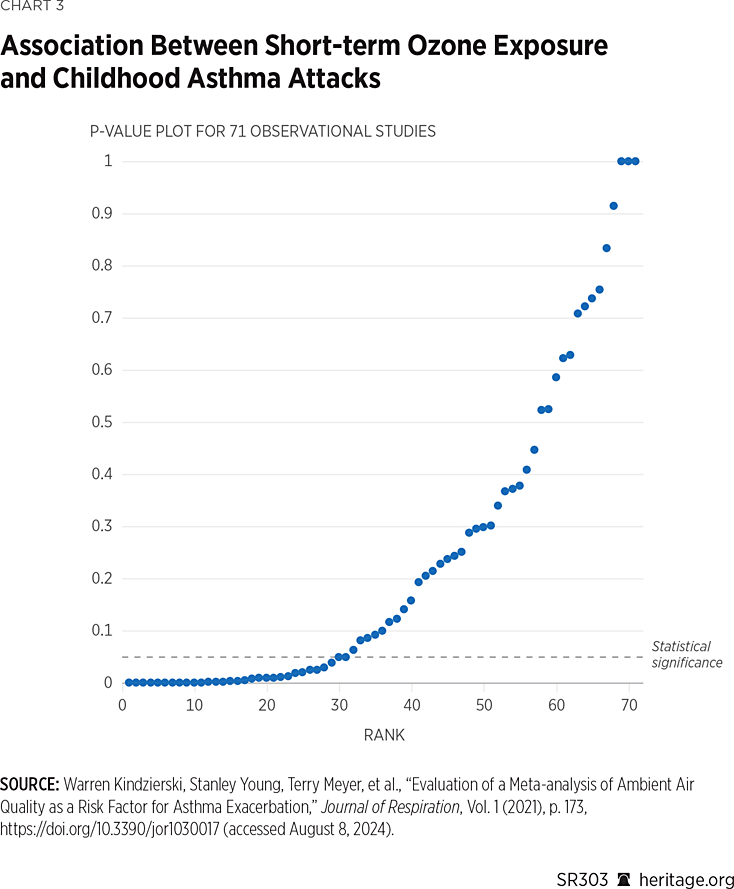
The first claim was tested on a meta-analysis of 71 observational studies.REF The p-values were calculated from relative risks and confidence intervals and are presented in a p-value plot. (See Chart 3.)
The second claim was tested using results from a critical review.REF These results were from a selection of 17 observational studies examining the association between long-term ozone exposure and development of childhood asthma. The p-values were calculated from relative risks and confidence intervals used in the critical review and are presented in a p-value plot. (See Chart 4.)
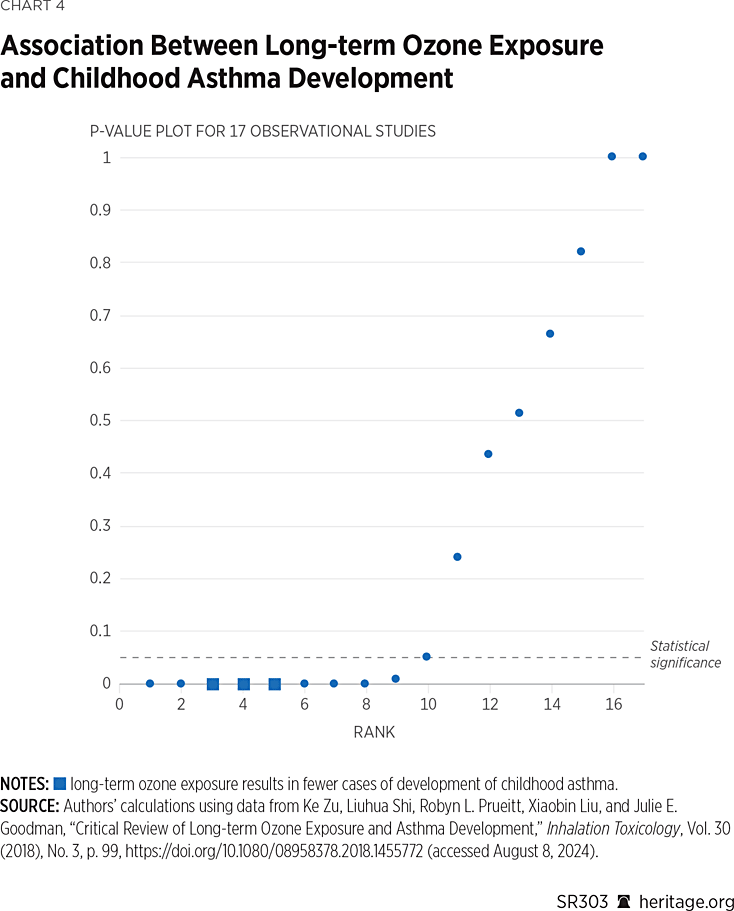
The p-value trends in Charts 3 and 4 depart from the uniform distribution. Both present as two-component mixtures. As noted earlier, it is possible and likely in ozone–asthma observational studies to test more than 10,000 hypotheses on a data set. The observational studies represented in both charts are no different. Multiple testing and selective reporting biases cannot be ruled out as explanations for the small p-values and the two-component p-value mixtures shown in these charts.
One form of multiple testing involving the search for significance during multiple testing of a data set is called “p-hacking.”REF Whether p-hacking was used in the observational studies cannot be ruled out when only a few of the results are presented from the thousands of tests that are likely performed.
Charts 3 and 4 do not support real exposure–disease associations. The charts do not show evidence of distinct sample distributions for true effects between two variables—that is, p-values mostly less than 0.05 and falling on a line with a shallow slope in the plot. These charts show heterogeneous data sets and that both ozone–asthma research claims cannot be reproduced.
Independent studies that use sound research practices (good study technique, randomization, blocking, blinding, and unbiased peer review, among others)REF should be able to provide unbiased risk statistics that differ from one another only by chance. However, these practices are not features of observational studies, including the ozone–asthma observational studies referred to here.
Non-randomized designs typical of observational studies—including those referred to here—are unable to address biases and confounding that lurk, often unmeasured and unobserved.REF Spurious risk statistics that resemble genuine effects can easily occur in ozone–asthma observational studies when, in fact, they are nothing more than artifacts of these hidden biases and confounding.
Animal Studies with Ozone
The EPA has hypothesized several mechanisms for how short-term or long-term ozone exposure may cause an asthma attack or onset of asthma, in part based on animal toxicology studies.REF These hypothesized mechanisms are based on limited understanding.
Animal toxicology studies use mostly rats, mice, or guinea pigs. They are performed in laboratories under controlled conditions. They model only for asthma, and they are artificial for a number of reasons. (See Table 3.)REF
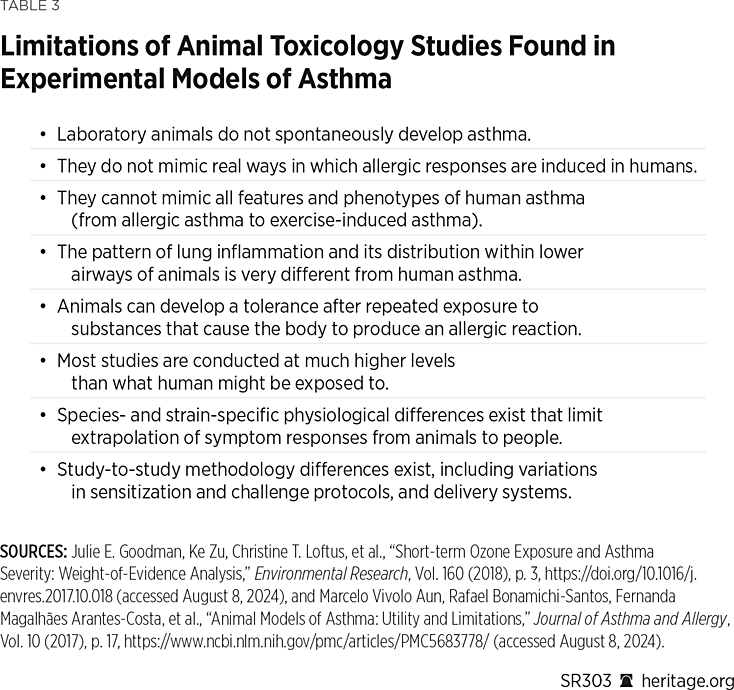
Animal models are of limited value, making it difficult to generalize their results to humans. Typical laboratory animals do not spontaneously develop asthma. Many approaches used in the toxicology studies cannot be translated to human disease. Further, animals cannot be tested in the traditional ways that people are diagnosed for asthma or asthma symptoms.
Consequently, animal models offer only hypothesized mechanisms for how ozone may cause an asthma attack or onset of asthma in people. Given the nature of asthmatics and their airway hyperactivity and sensitivity, animal toxicology studies do not establish ozone exposures as proof of causation of asthma or asthma symptoms.
Conclusion
The Climate Change–Ozone Hypothesis. The EPA’s own data for emissions of ozone precursors and ozone levels recorded at air monitoring stations in the United States over the past several decades show very different trends (declines) to what climate change models are predicting in the future. These climate change predictions should be treated with skepticism. Any potential impacts theorized from climate change are too small to be disaggregated (separated) from other factors.
The Ozone–Asthma Hypothesis. Ozone is a simple, small molecule. It does not have the structure to trigger an immune response. Uncertainty exists in hypothesized mechanisms by which short-term (or long-term) ozone exposure might worsen asthmatic symptoms (or lead to the onset of asthma). Chamber studies using healthy, non-asthmatic adults exercising are unreliable. This is due to hidden measurement error and questionable clinical significance that their results have to real asthma attacks in asthmatics.
Ozone–asthma observational studies are not founded on proven biological plausibility of ozone causing asthma symptoms or onset of asthma. They are founded on an assumption of what may be a cause of respiratory disease and harm. These observational studies are largely exercises in multiple testing and selective reporting biases.
They have problems with weak statistical results and possible and likely spurious results that resemble genuine effects, which can easily occur in these studies when, in fact, they are artifacts of these biases. It is possible and likely that these studies will not reproduce their results in the absence of these biases.
Regarding animal toxicology studies of ozone exposure, animals cannot be tested in the traditional ways that people are diagnosed with asthma or asthma symptoms. Hypothesized cause–effect mechanisms from animal toxicology studies do not establish ozone exposures as proof of causation of asthma or asthma symptoms.
Taken together, the current information from chamber studies, observational studies, and animal toxicology studies does not offer credible support for an ozone–asthma hypothesis that is aggregated by modeled projections of climate change. The EPA’s claims that an increase in the abundance of ozone in the future will lead to climate-related health effects, including asthma, are not supported.
About the Authors
S. Stanley Young, PhD, was a Visiting Fellow for the Science Advisory Committee in Center for Energy, Climate, and Environment at The Heritage Foundation. He is currently CEO of CGStat in Raleigh, NC, and director of the National Association of Scholars’ Shifting Sands Project.
Warren B. Kindzierski, PhD, now retired, was a professor of public health at the University of Alberta, Canada, and a contributor to the Shifting Sands Project.


