Tornadoes wreak havoc in scattered locations throughout the world but are most prevalent in North America. Given the large amount of media attention that often accompanies these storms, they inevitably become part of the climate change debate.REF
This Backgrounder examines the relationship between trends in the frequency and severity of tornadoes and climate change. The authors find that despite increasing temperatures and carbon-dioxide (CO2) emissions, overall tornado trends do not appear to be linked to these changes. They also discuss the increases in economic damages that tornadoes have caused over time. These increases, however, are merely a manifestation of increasing wealth and a maturing society, and when normalized with respect to economic growth, the trends reverse, with decreases in normalized monetary damages.
The authors also assess naturally occurring factors that do affect tornado formation deviations from typical trends. The most prominent link to increased tornado activity is due to La Niña, a naturally occurring climate event that affects the jet stream over the U.S. and, so, the environmental ingredients needed for tornado formation. Nevertheless, while La Niña–related tornado outbreaks are newsworthy, they are superimposed on a long-term downward trend in strong tornado activity, and so any connection of tornadoes to climate change could be potentially beneficial, which is the opposite of the mainstream narrative.
U.S. Tornado Climatology
Although prevalent throughout the world, most tornado activity takes place in North America due to geographic features that lend themselves to the types of severe thunderstorms that ultimately cause tornadoes.REF This includes a source of warm, moist air at low altitudes from the Gulf of Mexico, encroaching cooler air at higher altitudes from the elevated terrain of the Western U.S., and a vigorous jet stream marking the boundary between warm and cool air masses providing the wind shear needed to produce rotating thunderstorms.
In the United States, tornadoes are most prevalent near the Gulf Coast from November to April, the Plains from May to early June, and the Northern Plains and Upper Midwest in June and July before the action shifts back toward the Southeast in the fall. While peak U.S. tornado months are March through August, tornadoes can occur any time given proper weather conditions.REF
Tornado formation in the U.S. requires a combination of favorable ingredients, often involving complex interactions.REF Two ingredients are arguably the most important: (1) warm, humid air from the Gulf of Mexico overlaid with a cooler air layer from the Western U.S. that is vertically well-mixed and thus unstable, and (2) significant vertical wind shear (wind speed rapidly increasing and wind direction changing with height in the atmosphere). While the availability of warm, moist air might be expected to increase somewhat with a warming climate, the second ingredient (wind shear) is expected to decrease as the high latitudes warm faster than the low latitudes, and it is that temperature contrast between air masses that usually causes the wind shear associated with tornadic thunderstorms.
But no matter what might be expected from a theoretical standpoint with climate change, a key question is: What do measured trends in U.S. tornadoes look like, and how do they compare to warming trends? Not surprisingly, members of academia as well as of the U.S. federal government have speculated about a causal connection. For example, in 2013,REF Noah Diffenbaugh, Martin Scherer, and Robert J. Trapp argued in their study that tornado activity would increase with climatic warming due to greater availability of warm, humid air to fuel severe thunderstorms. More recently, the Fifth National Climate Assessment claimed that severe storms are becoming more frequent in the U.S. as a result of human-caused climate change.REF
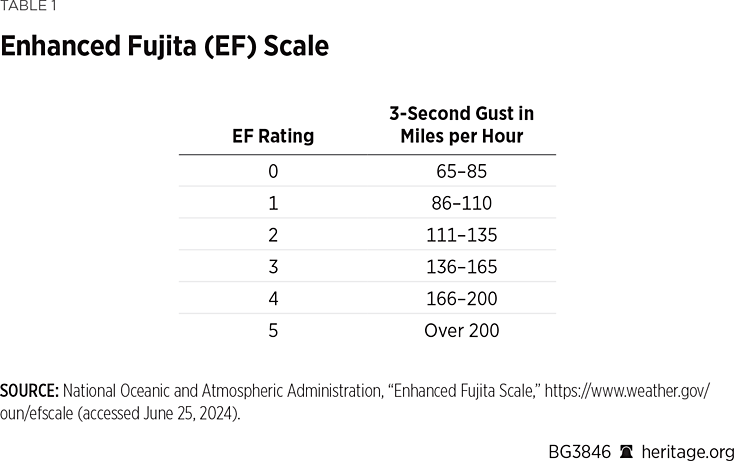
Fortunately, the National Oceanic and Atmospheric Administration’s Storm Prediction Center provides carefully validated tornado statistics in the U.S. since 1950,REF which allows scientists to test the claims of climate change causing more tornadoes. Since 1973, tornado intensity has been ranked on the Enhanced Fujita (EF) scale of storm damage, from weak (EF0 and EF1) to strong (EF2 and EF3) to violent (EF4 and EF5). The wind speeds associated with these scales are described in Table 1.
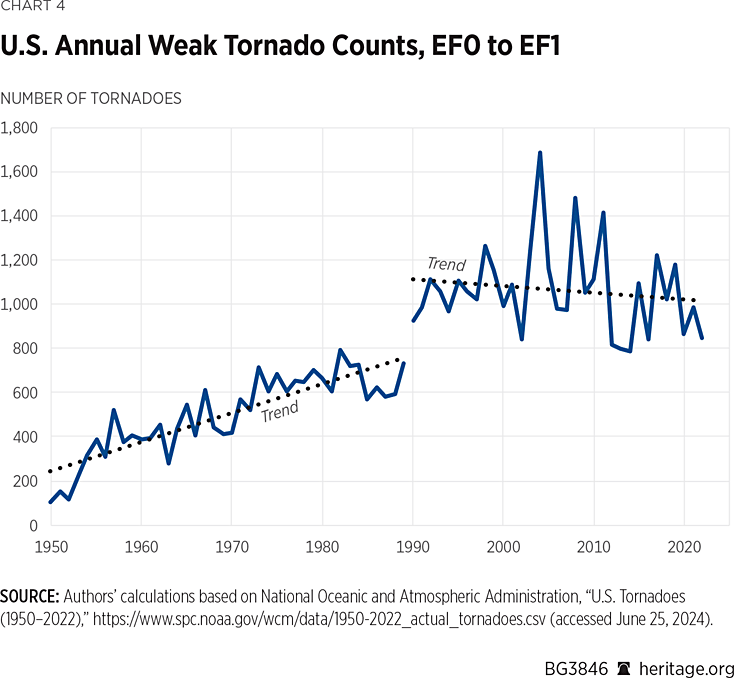
Charts 1–4 provide insight on the relationship between tornadoes and climate change. Chart 1 presents spring and summertime daytime temperatures in the United States, and Chart 2 depicts CO2 emissionsREF over this time period, putatively the cause of the warming seen in Chart 1. Charts 3 and 4 depict trends in the frequency of strong and weak tornadoes, respectively.
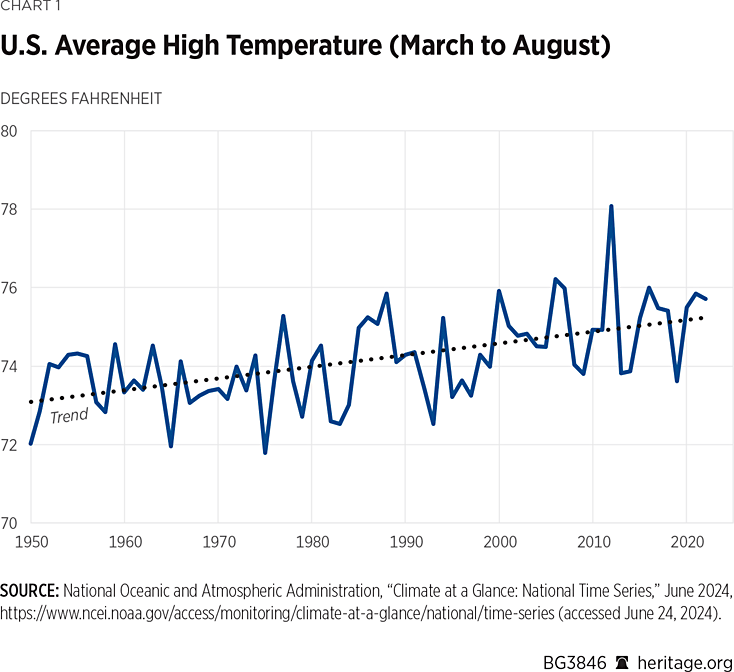
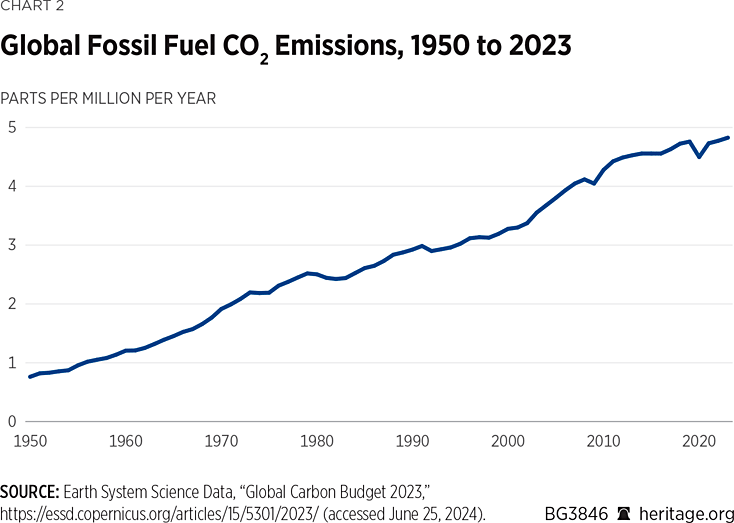
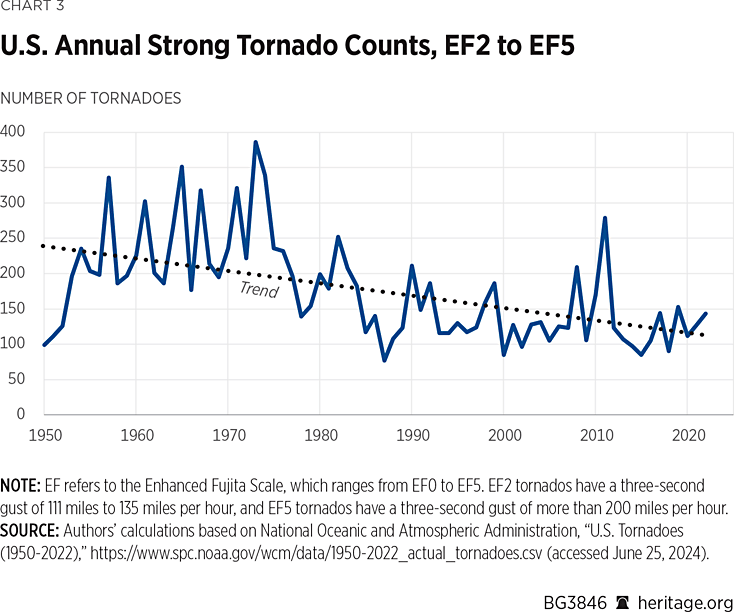
As Chart 1 illustrates, spring and summer daytime temperatures in the U.S. have warmed during the period for which tornado data are archived, while CO2 emissions have increased (Chart 2). Major tornadoes, on the other hand, have exhibited a major downward trend, as illustrated in Chart 3, corresponding to a 50+ percent reduction in strong to violent tornado activity since the mid-20th century. As of early 2024, the U.S. has not seen an EF5 tornado in more than 10 years, the longest such streak since at least 1950.REF
As seen in Chart 4, however, weak tornadoes have elicited mixed results—increasing trends between 1950 and 1990 and a slight downward trend since. Thus, while Diffenbaugh, Scherer, and Trapp claimed in their 2013 study that the warm and humid air effect would dominate during global warming, even a decade after the study was published Charts 3 and 4 fail to reveal a climate-induced increase, despite modest warming in the United States.
The La Niña and El Niño Effect on Tornado Occurrence
Despite the long-term downward trend in strong and violent tornadoes in Chart 3, there do appear to be spikes in activity in some years, most notably in 2011. These fluctuations correspond with naturally occurring climate oscillations known as the El Niño-Southern Oscillation (ENSO) cycle. ENSO is a natural climate cycle composed of fluctuating periods of warming and cooling in the central and eastern areas of the Pacific Ocean near the Equator. El Niño and La Niña are the opposite phases of the ENSO oscillation. In particular, El Niño is the warmer ENSO phase noted by a significant increase in sea surface temperature (SST) across the eastern and central equatorial Pacific Ocean. La Niña, on the other hand, is the cool phase of ENSO, described by colder SST in the eastern and central equatorial Pacific Ocean.
It is well known that El Niño and La Niña alter the natural flow of weather systems across the U.S., including the location and strength of the jet stream.REF The jet stream, in turn, represents the boundary between cool and warm air masses, and so it affects the wind shear necessary for tornado formation. Over the years, a number of studies have tried to establish a connection between ENSO and tornado activity, with mixed results.REF As more data have become available, though, patterns have begun to emerge. A 2015 study in Nature Geoscience examined the relationship between tornado and hail activity with ENSO fluctuations. The study found that tornado and hail activity occurs most frequently in La Niña years, which are favored when the eastern North Pacific is cold (also when the Pacific Decadal Oscillation is cold) as it was in the 1950s to the mid-1970s, and more recently in 1999, 2008, 2010, and 2011.REF The strong La Niña of 2011 produced the highest U.S. tornado death count on record (533 deaths) and the highest strong-to-violent tornado count (84) since the strong La Niña year of 1974,REF with 131 strong-to-violent tornadoes.
The Multivariate ENSO Index, often referred to as MEI, is a measure used to quantify the intensity of ENSO cycles. The MEI is calculated bi-monthly and amalgamates several key meteorological variables into a single value. These variables typically include SST, air temperature, sea-level pressure, surface wind, and cloudiness. The MEI offers a comprehensive measure of the ENSO state by capturing its impacts on these different aspects of the Earth’s climate system. A positive MEI value generally indicates El Niño conditions, while a negative value indicates La Niña conditions.
Charts 5 and 6 compare the average annual MEI with tornadoes of varying intensity (using the EF scale) between 1958 and 2022.
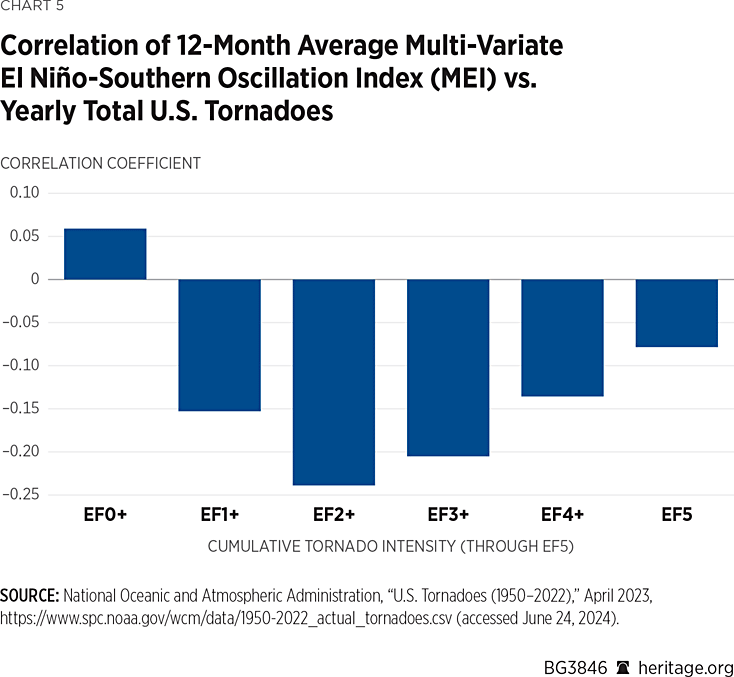
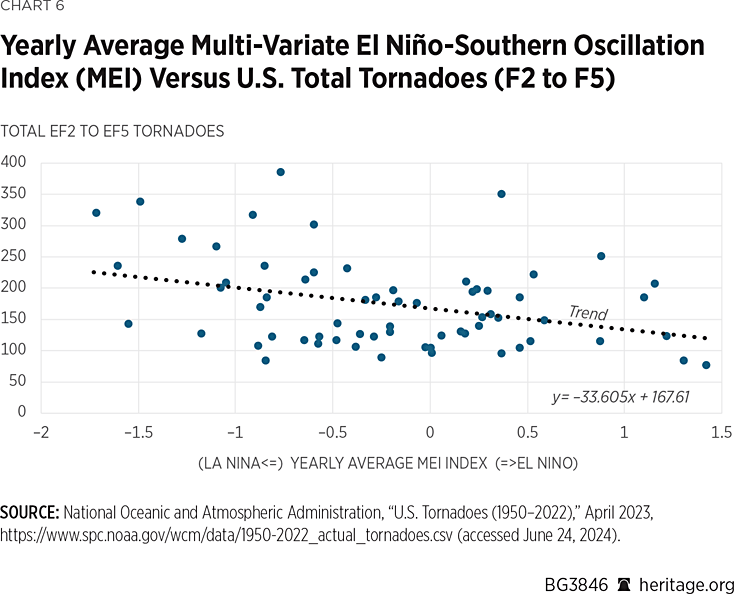
As Chart 5 illustrates, there is a weak (negative) correlation between the monthly average MEI and tornado intensity. Chart 6 depicts the relationship between the total number of tornadoes (exceeding the F2 level) and yearly average MEI.
These charts reveal a clear relationship between the MEI and the incidence of tornadoes at or exceeding the F2 level. Thus, large variations in year-to-year tornado activity can be explained by natural climate oscillations like ENSO, a fact which must be remembered when a particularly intense tornado year is experienced. But major tornadoes have still declined over the decades and offer a stark contrast to media reports attempting to draw a connection between specific tornado outbreaks and climate change. This misconception is exacerbated by a public that has become accustomed to fewer violent tornadoes precisely due to this long-term decline. When outbreaks inevitably occur, they seem more unusual, and unusual weather is blamed on climate change despite statistics to the contrary.
Regardless of their trends or fluctuations, when tornadoes do hit populated areas, they can cause significant damage to property. These damages are discussed in the following section.
Normalized Tornado Damage Has Declined
Table 2 lists the 10 costliest tornadoes since 1950 in terms of damages.
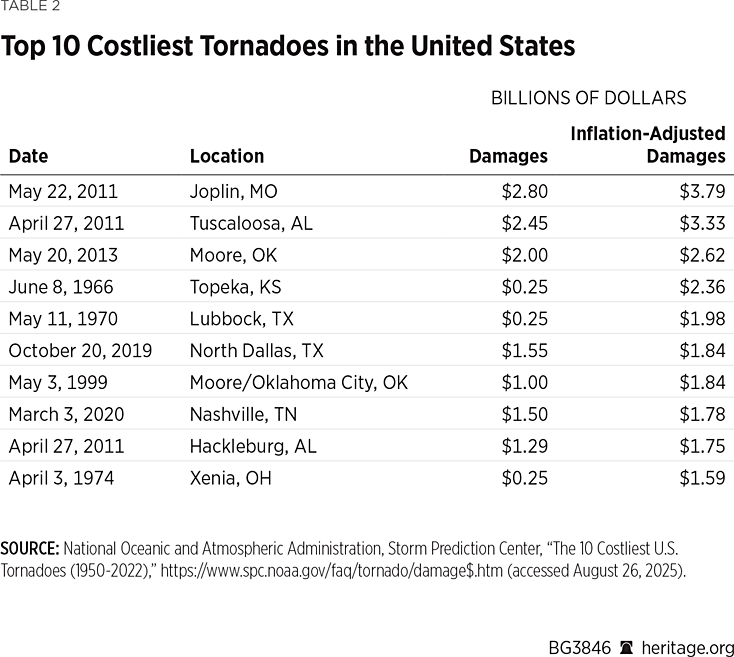
As seen in Table 2, six of the 10 most damaging tornadoes have occurred since 2010. This finding is not surprising. In recent decades, population growth and expansion outside urban areas have exposed more people and buildings to the tornadoes that once roared through open fields. As a result, when tornadoes do strike these areas, there is more property to damage, and thus damages will become more costly, even after adjusting for inflation. Thus, despite a long-term roughly 50 percent decrease in strong to violent tornado occurrences in the U.S. noted in Chart 3, tornadoes can—and do—cause increased damages.
To account for a growing economy, it is worthwhile to examine these damages with respect to economic growth. This question was examined in a 2013 study by Kevin Simmons, Daniel Sutter, and Roger Pielke in the journal Environmental Hazards.REF In particular, the study normalized U.S. tornado damage with respect to changes in population, income, and housing, examining associated trends across time. One of the authors recently updated the analysis through 2022, which is depicted in Chart 7.
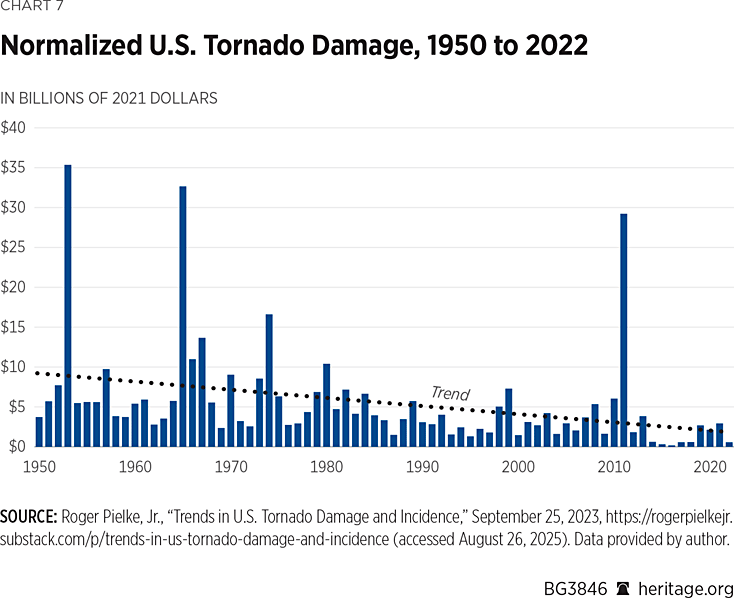
As Chart 7 illustrates, there has been a strong downward trend in tornado damages after normalization for growth since the 1950s. This trend is consistent with trends in tornadoes, especially strong tornadoes, over time. Furthermore, their normalized U.S. tornado damage has been at exceptionally low levels since the active 2011 season. The period from 2015 to 2020 had the second-lowest normalized tornado damage of any five-year period since 1950. A 2023 study published in Weather and Climate Extremes replicated the methods of the study by Simmons, Sutter, and Pielke with updated data and independently arrived at very similar conclusions.REF The bottom line is: After accounting for economic growth and development, damages due to tornadoes have decreased over time. As societies mature, they are more capable of “weathering” adverse events that come their way.
Conclusion
Despite a modest warming trend, the claim that climate change is causing more and stronger tornadoes in the U.S. is unsupported by the relevant trend data. Most notably, tornado frequency has elicited a decline of at least 50 percent in all but the weakest tornadoes since the inception of these statistics in 1950. Although the number of weak tornadoes increased from 1950 to 1990, this increase may be in part explained due to an expanding, weather-conscious population increasingly armed with cameras—and that increase stopped more than 30 years ago. Fluctuations in these trends do indeed occur, as can be seen in Charts 3 and 4; however, the fluctuations are largely manifestations of natural climactic cycles, such as El Niño and La Niña.
Tornadoes that once roared through mostly open fields now more frequently devastate areas that have since experienced significant population growth and urbanization. As a result, tornadoes that have struck such areas have indeed resulted in increased damages. But when these damages are normalized with respect to the growing and maturing economy, these increases disappear.
Taken together, these results refute the implication of the Fifth National Climate Assessment that severe storms are becoming more frequent and stronger and causing more damage across the United States. Indeed, the frequency and intensity of tornadoes varies over time, but not due to CO2 emissions. If anything, modest warming in the U.S. has been accompanied by a decrease in strong to violent tornado activity.
Joe D’Aleo is Executive Director of Icecap.Us and Co-Chief Meteorologist at Weatherbell Analytics, LLC. Roy W. Spencer, PhD, performs scientific research on climate change as a Principal Research Scientist at the University of Alabama in Huntsville.


